- Page 1 and 2: Socio-cultural Processes and Liveli
- Page 3 and 4: karanavakkoottams and helping us wi
- Page 5 and 6: Obligor Project Team Dr. P.P.Mohamm
- Page 7 and 8: Socio-cultural processes and Liveli
- Page 9 and 10: . CONTENTS I. Introduction 1 II. Hi
- Page 11 and 12: XXXV Revenue Settlement of Parappan
- Page 13 and 14: Socio-cultural processes and liveli
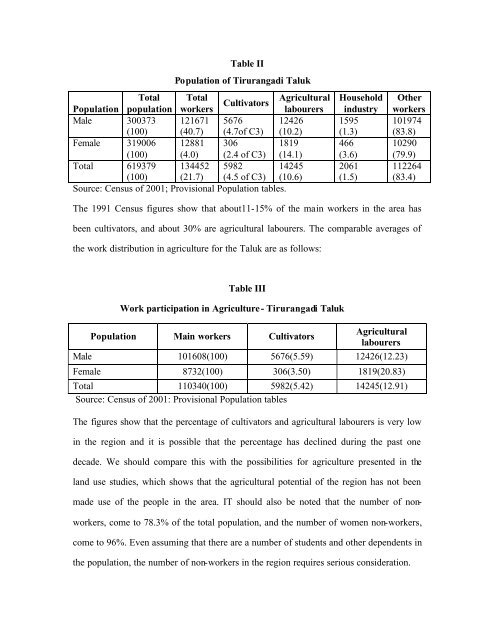
- Page 15: particularly in rural areas like Ti
- Page 19 and 20: All these show that the tendencies
- Page 21 and 22: as built environment by some geogra
- Page 23 and 24: way seems to be to take the hard, b
- Page 25 and 26: II History of the field work done b
- Page 27 and 28: Chenganasseri(Kottayam), Kunninmel(
- Page 29 and 30: cultural artifacts also, such as ar
- Page 31 and 32: and one is controlled by the LDF. T
- Page 33 and 34: The research team had decided that
- Page 35 and 36: of the survey. Since it was a sampl
- Page 37 and 38: Preliminaries III Walking Tiruranga
- Page 39 and 40: identify some features of naming. N
- Page 41 and 42: Chengani Nadukkara Parampil peetika
- Page 43 and 44: Table VI Place name Paramba Kavu Ow
- Page 45 and 46: Transformation of the pristine para
- Page 47 and 48: As an illustration of this process,
- Page 49 and 50: pond in a pallyal, and the stored w
- Page 51 and 52: Perunthodu have suffered the same f
- Page 53 and 54: Chelari Table VIII Place name Name
- Page 55 and 56: The transformation is illustrated b
- Page 57 and 58: have been traditionally used for im
- Page 59 and 60: one or two features of the observat
- Page 61 and 62: Placename Paramba/field Path or lan
- Page 63 and 64: The situation is different in the l
- Page 65 and 66: such as Amalpori, Neela amari, Umma
- Page 67 and 68:
cleared) and old house- sites, such
- Page 69 and 70:
Apart from the large trees, a numbe
- Page 71 and 72:
Added to this is the change occurri
- Page 73 and 74:
stop, school, and so on. In an agra
- Page 75 and 76:
house-sites. Interestingly a large
- Page 77 and 78:
members of the family stay in the o
- Page 79 and 80:
an all-inclusive structure with res
- Page 81 and 82:
The implications of this rapidly sp
- Page 83 and 84:
Alameen nagar Koyappayil Paramba Ki
- Page 85 and 86:
Market centers Observations on the
- Page 87 and 88:
Panchayat Placename Market centre f
- Page 89 and 90:
Olipramkadavu to kadakkattupara in
- Page 91 and 92:
flourished even a generation before
- Page 93 and 94:
has been a major transformation in
- Page 95 and 96:
The equally important feature is th
- Page 97 and 98:
karimkutti, Gulikan, muththappan, k
- Page 99 and 100:
Source: Field diaries, Vallikkunnu
- Page 101 and 102:
Day ten Day eleven Day twelve Day t
- Page 103 and 104:
with khabr. Srambis are seen virtua
- Page 105 and 106:
y the early half of 19 th century,
- Page 107 and 108:
shops being brought down within a f
- Page 109 and 110:
Larger temples are fewer in number
- Page 111 and 112:
possibly the sea could enter and wo
- Page 113 and 114:
Thenhippalam 10* 6 3 1** University
- Page 115 and 116:
Nannambra 2 20 * indicates only gen
- Page 117 and 118:
The response to education and healt
- Page 119 and 120:
they are able to do it, is another
- Page 121 and 122:
enthusiasm was not shown by middle
- Page 123 and 124:
Peruvallur Munniyur Nannambra Parap
- Page 125 and 126:
kolkali gurukkal in the area. Now k
- Page 127 and 128:
field area. There are kalapoottu ka
- Page 129 and 130:
eported, such as mullanmada in Vall
- Page 131 and 132:
IV Tirurangadi-Historical and Cultu
- Page 133 and 134:
(randuteru) and Chelari as examples
- Page 135 and 136:
However, the first indication a pol
- Page 137 and 138:
Ariyallur and Nirakaithakotta templ
- Page 139 and 140:
included families such as kizhakkin
- Page 141 and 142:
conducted by five tharas, kuroortha
- Page 143 and 144:
areas show the presence of the Naha
- Page 145 and 146:
mention migrations from Tanur, Vail
- Page 147 and 148:
appears to have been relatively les
- Page 149 and 150:
They were settlements of cultivator
- Page 151 and 152:
The British army was led by Col.Har
- Page 153 and 154:
distances, are too numerous to be d
- Page 155 and 156:
the Rajas of Beypore, Parappanad an
- Page 157 and 158:
to the landlord was only possible o
- Page 159 and 160:
e replaced by other cash crops prim
- Page 161 and 162:
there was no effort to convert them
- Page 163 and 164:
are extensively cultivated. The ele
- Page 165 and 166:
these privileges were used against
- Page 167 and 168:
the great disparities in the agrari
- Page 169 and 170:
Nannambra 881 4481 1432(31.96) 3049
- Page 171 and 172:
upees above 1000acres - 1 - - - 1 0
- Page 173 and 174:
in Parappanangadi held most of the
- Page 175 and 176:
Desam Total Assessed Land(in acres
- Page 177 and 178:
centre. Along with the mosques, the
- Page 179 and 180:
British as the most dangerous to th
- Page 181 and 182:
emoving the blouse, Panikkar had he
- Page 183 and 184:
carried off the bodies and buried t
- Page 185 and 186:
autonomous spaces. Spiritual work t
- Page 187 and 188:
one. The Thangals were seen as the
- Page 189 and 190:
open. Sayyid Fasl’s son Sayyid Hy
- Page 191 and 192:
The railroad also brought about cha
- Page 193 and 194:
logged areas. Old working women als
- Page 195 and 196:
Malabar Rebellion in Tirurangadi It
- Page 197 and 198:
Fasli Rice (second sort) 1313 1314
- Page 199 and 200:
It is not surprising that the repre
- Page 201 and 202:
escaped. Ali Musaliar was sentenced
- Page 203 and 204:
widespread in the region. We should
- Page 205 and 206:
cooperation movement and the subseq
- Page 207 and 208:
Survey 1905 1935 Total No. of holdi
- Page 209 and 210:
Survey 1905 1935 Total no. of holdi
- Page 211 and 212:
The information given above can now
- Page 213 and 214:
Crop Variety Trikkulam Desam Parapp
- Page 215 and 216:
cultivation which does not require
- Page 217 and 218:
In the case of Tirurangadi, even th
- Page 219 and 220:
away from their homes. They were al
- Page 221 and 222:
opening of a number of ‘Mappila
- Page 223 and 224:
eligious instruction apart from lea
- Page 225 and 226:
profile of the people they were dea
- Page 227 and 228:
Keranallur thodu or Connolly thodu.
- Page 229 and 230:
job of burying the corpses. The inf
- Page 231 and 232:
second the emergence of he Muslim l
- Page 233 and 234:
The incident of Sayyid Ali is revea
- Page 235 and 236:
people were the most manifest. Afte
- Page 237 and 238:
indication of this is shown by the
- Page 239 and 240:
in favor of a compromise with the d
- Page 241 and 242:
egulated by the Mahal Committee. Th
- Page 243 and 244:
Pakistan or India, and he chose Ind
- Page 245 and 246:
Illiterate 26533 40533 13796 19590
- Page 247 and 248:
others 12 37 Source: Census of 1951
- Page 249 and 250:
Kaprat family has left the place, a
- Page 251 and 252:
The data given in table LV shows th
- Page 253 and 254:
Peruvallur 3270 (43.97) (4.49) (25.
- Page 255 and 256:
their labor resources in the area w
- Page 257 and 258:
like thekkan, otiyan, nayaru, vella
- Page 259 and 260:
egan to be used, primary because
- Page 261 and 262:
problems in continuing as farmers,
- Page 263 and 264:
the gradual spread of rented holdin
- Page 265 and 266:
animal husbandry of this kind has r
- Page 267 and 268:
So it is clear that although land r
- Page 269 and 270:
stores, TV showrooms and repair sho
- Page 271 and 272:
are prepared to spend on the work.
- Page 273 and 274:
number of computer institutes. Lite
- Page 275 and 276:
Major section Domestic Agricultural
- Page 277 and 278:
programme called Akshaya project, w
- Page 279 and 280:
and an ordinary housewife to have a
- Page 281 and 282:
The growth of the religious space h
- Page 283 and 284:
who are more educated, as the passp
- Page 285 and 286:
migrations to different parts of In
- Page 287 and 288:
scale chanthas of the kind of Tirur
- Page 289 and 290:
was reconstituted into Thenhippalam
- Page 291 and 292:
Table LXIX Sectors Plan funds Plan
- Page 293 and 294:
also available. A more detailed wat
- Page 295 and 296:
higher than either Bharatapuzha or
- Page 297 and 298:
hence are rendered useless. The rai
- Page 299 and 300:
Type of agricultural Product Paddy(
- Page 301 and 302:
Disappearance of the thodus, mentio
- Page 303 and 304:
Munniyur 645 1881 2526 438 761 1199
- Page 305 and 306:
sustained them. This destruction of
- Page 307 and 308:
subsist in the area of servicing. E
- Page 309 and 310:
the ‘modern’ cult of Gold, whic
- Page 311 and 312:
The trends seem to be clear. The de
- Page 313 and 314:
Pattasseri, Palakkad, Chonari, Anch
- Page 315 and 316:
determined by the floating middle c
- Page 317 and 318:
consumerist tendency outlined above
- Page 319 and 320:
deprived sections favor the surviva
- Page 321 and 322:
already saw that majority of the su
- Page 323 and 324:
never create a system of production
- Page 325 and 326:
alternative to be developed will be
- Page 327 and 328:
planting of mangroves, kaitha, paya
- Page 329 and 330:
the planning of wetlands should con
- Page 331 and 332:
women, it is possible to argue that
- Page 333 and 334:
laboring groups become the central
- Page 335 and 336:
experimented during the People’s
- Page 337 and 338:
VI Conclusion and Major Findings Th
- Page 339 and 340:
Religious faith thus complements th
- Page 341 and 342:
Abdul Sattar, K.K.Mohammed, History
- Page 343 and 344:
Thenhippalam Grama Panchayat, Do Ti
- Page 345 and 346:
I Panchayat Public Library Reading
- Page 347 and 348:
Village Manufacturing household Oth
- Page 349 and 350:
Bullocks He- buffaloes cows Bulls&
- Page 351:
Pathan - - - - - - - - Other mohamm