FY2014 Recommended Budget - City of Surprise
FY2014 Recommended Budget - City of Surprise
FY2014 Recommended Budget - City of Surprise

You also want an ePaper? Increase the reach of your titles
YUMPU automatically turns print PDFs into web optimized ePapers that Google loves.
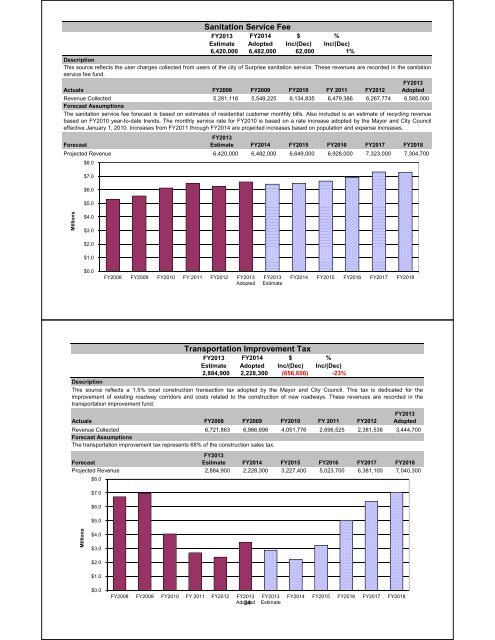
Sanitation Service Fee<br />
FY2013 <strong>FY2014</strong> $ %<br />
Estimate Adopted Inc/(Dec) Inc/(Dec)<br />
6,420,000 6,482,000 62,000 1%<br />
Description<br />
This source reflects the user charges collected from users <strong>of</strong> the city <strong>of</strong> <strong>Surprise</strong> sanitation service. These revenues are recorded in the sanitation<br />
service fee fund.<br />
FY2013<br />
Actuals FY2008 FY2009 FY2010 FY 2011 FY2012 Adopted<br />
Revenue Collected 5,281,116 5,549,225 6,134,835 6,479,386 6,267,774 6,585,000<br />
Forecast Assumptions<br />
The sanitation service fee forecast is based on estimates <strong>of</strong> residential customer monthly bills. Also included is an estimate <strong>of</strong> recycling revenue<br />
based on FY2010 year-to-date trends. The monthly service rate for FY2010 is based on a rate increase adopted by the Mayor and <strong>City</strong> Council<br />
effective January 1, 2010. Increases from FY2011 through <strong>FY2014</strong> are projected increases based on population and expense increases.<br />
FY2013<br />
Forecast Estimate <strong>FY2014</strong> FY2015 FY2016 FY2017 FY2018<br />
Projected Revenue 6,420,000 6,482,000 6,649,000 6,928,000 7,323,000 7,304,700<br />
Millions<br />
$8.0<br />
$7.0<br />
$6.0<br />
$5.0<br />
$4.0<br />
$3.0<br />
$2.0<br />
$1.0<br />
$0.0<br />
FY2008 FY2009 FY2010 FY 2011 FY2012 FY2013<br />
Adopted<br />
FY2013<br />
Estimate<br />
Transportation Improvement Tax<br />
FY2013 <strong>FY2014</strong> $ %<br />
Estimate Adopted Inc/(Dec) Inc/(Dec)<br />
2,884,900 2,228,300 (656,600) -23%<br />
<strong>FY2014</strong> FY2015 FY2016 FY2017 FY2018<br />
Description<br />
This source reflects a 1.5% local construction transaction tax adopted by the Mayor and <strong>City</strong> Council. This tax is dedicated for the<br />
improvement <strong>of</strong> existing roadway corridors and costs related to the construction <strong>of</strong> new roadways. These revenues are recorded in the<br />
transportation improvement fund.<br />
FY2013<br />
Actuals FY2008 FY2009 FY2010 FY 2011 FY2012 Adopted<br />
Revenue Collected 6,721,863 6,986,698 4,051,776 2,696,525 2,381,538 3,444,700<br />
Forecast Assumptions<br />
The transportation improvement tax represents 68% <strong>of</strong> the construction sales tax.<br />
Forecast<br />
FY2013<br />
Estimate <strong>FY2014</strong> FY2015 FY2016 FY2017 FY2018<br />
Projected Revenue<br />
$8 $8.0 0<br />
2,884,900 2,228,300 3,227,400 5,023,700 6,381,100 7,040,300<br />
Millions<br />
$7.0<br />
$6.0<br />
$5.0<br />
$4.0<br />
$3.0<br />
$2.0<br />
$1.0<br />
$0.0<br />
FY2008 FY2009 FY2010 FY 2011 FY2012 FY2013<br />
Adopted 34<br />
FY2013<br />
Estimate<br />
<strong>FY2014</strong> FY2015 FY2016 FY2017 FY2018