FY2014 Recommended Budget - City of Surprise
FY2014 Recommended Budget - City of Surprise
FY2014 Recommended Budget - City of Surprise

You also want an ePaper? Increase the reach of your titles
YUMPU automatically turns print PDFs into web optimized ePapers that Google loves.
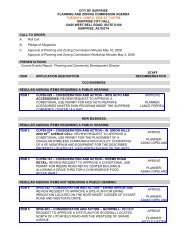
Wastewater Development Fee<br />
FY2013 <strong>FY2014</strong> $ %<br />
Estimate Adopted Inc/(Dec) Inc/(Dec)<br />
2,249,400 2,365,700 116,300 5%<br />
Description<br />
This source reflects one-time impact fees (latest revision effective 01/01/2012) charged to developers to recover costs associated with<br />
providing wastewater related facilities and services to the community. This revenue is collected specifically to fund growth related projects<br />
and activities. Authorized under A.R.S. 9-463.05 and city ordinance # 07-18. These revenues are recorded in the wastewater development<br />
impact fee funds.<br />
FY2013<br />
Actuals FY2008 FY2009 FY2010 FY 2011 FY2012 Adopted<br />
Revenue Collected 12,427,298 2,832,405 2,061,007 1,590,925 2,007,881 1,051,800<br />
Forecast Assumptions<br />
The revenue forecast for FY2013 is based on estimates from the Community and Economic Development Department <strong>of</strong> the number <strong>of</strong><br />
single family residential permits issued and the square feet <strong>of</strong> non-single family residential permits issued. The 2014-2016 permits issued for<br />
single family residential permits were based on the conservative forecast estimates in the Elliot Pollack - <strong>City</strong> <strong>of</strong> <strong>Surprise</strong> Economic<br />
Conditons Report dated March 2012. FY2017 single family residential permits issued was a conservative estimate by the Finance dept<br />
based on the growth patterns from the Elliot Pollack Study. Non-single family residential permits include multi-family, <strong>of</strong>fice/institution, and<br />
commercial/customer service. This source has been decreasing due to reduced construction activity from the current recession. CED<br />
estimated FY2013 and years <strong>FY2014</strong>-2017 were conservative estimates done by Finance based on the FY2013 estimate.<br />
FY2013<br />
Forecast Estimate <strong>FY2014</strong> FY2015 FY2016 FY2017 FY2018<br />
Projected Revenue 2,249,400 2,365,700 4,094,800 6,693,900 8,751,600 9,691,600<br />
Millions<br />
$14.0<br />
$12.0<br />
$10.0<br />
$8.0<br />
$6.0<br />
$4.0<br />
$2.0<br />
$0.0<br />
FY2008 FY2009 FY2010 FY 2011 FY2012 FY2013<br />
Adopted<br />
FY2013<br />
Estimate<br />
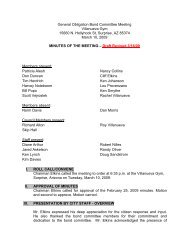
Fire and EMS Development Fee<br />
FY2013 <strong>FY2014</strong> $ %<br />
Estimate Adopted Inc/(Dec) Inc/(Dec)<br />
623,900 579,100 (44,800) -7%<br />
<strong>FY2014</strong> FY2015 FY2016 FY2017 FY2018<br />
Description<br />
This source reflects one-time impact fees (latest revision effective 01/01/2012) charged to developers to recover costs associated with<br />
providing fire and emergency facilities and services to the community. This revenue is collected specifically to fund growth related activities.<br />
Authorized under A.R.S. 9-463.05 and city ordinance # 07-22. These revenues are recorded in the fire and EMS development impact fee<br />
fund.<br />
FY2013<br />
Actuals FY2008 FY2009 FY2010 FY 2011 FY2012 Adopted<br />
Revenue Collected 1,587,234 4,953,819 305,813 542,968 580,176 312,600<br />
Forecast Assumptions<br />
The revenue forecast for FY2013 is based on estimates from the Community and Economic Development Department <strong>of</strong> the number <strong>of</strong><br />
single family residential permits issued and the square feet <strong>of</strong> non-single family residential permits issued. The 2014-2016 permits issued for<br />
single family residential permits were based on the conservative forecast estimates in the Elliot Pollack - <strong>City</strong> <strong>of</strong> <strong>Surprise</strong> Economic<br />
Conditons Report dated March 2012. FY2017 single family residential permits issued was a conservative estimate by the Finance dept<br />
based on the growth patterns from the Elliot Pollack Study. Non-single family residential permits include multi-family, <strong>of</strong>fice/institution, and<br />
commercial/customer service. This source has been decreasing due to reduced construction activity from the current recession. CED<br />
estimated FY2013 and years <strong>FY2014</strong>-2017 were conservative estimates done by Finance based on the FY2013 estimate.<br />
Forecast<br />
FY2013<br />
Estimate <strong>FY2014</strong> FY2015 FY2016 FY2017 FY2018<br />
Projected Revenue 623,900 579,100 808,300 1,273,400 1,644,900 1,813,500<br />
Millions<br />
$6.0<br />
$5.0<br />
$4.0<br />
$3.0<br />
$2.0<br />
$1.0<br />
$0.0<br />
35<br />
FY2008 FY2009 FY2010 FY 2011 FY2012 FY2013<br />
Adopted<br />
FY2013<br />
Estimate<br />
<strong>FY2014</strong> FY2015 FY2016 FY2017 FY2018