FY2014 Recommended Budget - City of Surprise
FY2014 Recommended Budget - City of Surprise
FY2014 Recommended Budget - City of Surprise

You also want an ePaper? Increase the reach of your titles
YUMPU automatically turns print PDFs into web optimized ePapers that Google loves.
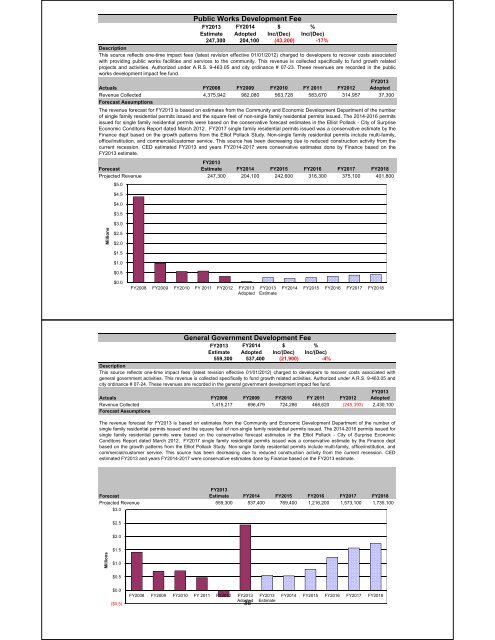
Public Works Development Fee<br />
FY2013 <strong>FY2014</strong> $ %<br />
Estimate Adopted Inc/(Dec) Inc/(Dec)<br />
247,300 204,100 (43,200) -17%<br />
Description<br />
This source reflects one-time impact fees (latest revision effective 01/01/2012) charged to developers to recover costs associated<br />
with providing public works facilities and services to the community. This revenue is collected specifically to fund growth related<br />
projects and activities. Authorized under A.R.S. 9-463.05 and city ordinance # 07-23. These revenues are recorded in the public<br />
works development impact fee fund.<br />
FY2013<br />
Actuals FY2008 FY2009 FY2010 FY 2011 FY2012 Adopted<br />
Revenue Collected 4,375,942 982,080 563,728 583,670 314,957 37,300<br />
Forecast Assumptions<br />
The revenue forecast for FY2013 is based on estimates from the Community and Economic Development Department <strong>of</strong> the number<br />
<strong>of</strong> single family residential permits issued and the square feet <strong>of</strong> non-single family residential permits issued. The 2014-2016 permits<br />
issued for single family residential permits were based on the conservative forecast estimates in the Elliot Pollack - <strong>City</strong> <strong>of</strong> <strong>Surprise</strong><br />
Economic Conditons Report dated March 2012. FY2017 single family residential permits issued was a conservative estimate by the<br />
Finance dept based on the growth patterns from the Elliot Pollack Study. Non-single family residential permits include multi-family,<br />
<strong>of</strong>fice/institution, and commercial/customer service. This source has been decreasing due to reduced construction activity from the<br />
current recession. CED estimated FY2013 and years <strong>FY2014</strong>-2017 were conservative estimates done by Finance based on the<br />
FY2013 estimate.<br />
FY2013<br />
Forecast Estimate <strong>FY2014</strong> FY2015 FY2016 FY2017 FY2018<br />
Projected Revenue 247,300 204,100 242,600 316,300 375,100 401,800<br />
Millions<br />
$5.0<br />
$4.5<br />
$4.0<br />
$3.5<br />
$3.0<br />
$2.5<br />
$2.0<br />
$1.5<br />
$1.0<br />
$0.5<br />
$0.0<br />
FY2008 FY2009 FY2010 FY 2011 FY2012 FY2013<br />
Adopted<br />
FY2013<br />
Estimate<br />
General Government Development Fee<br />
FY2013 <strong>FY2014</strong> $ %<br />
Estimate Adopted Inc/(Dec) Inc/(Dec)<br />
559,300 537,400 (21,900) -4%<br />
<strong>FY2014</strong> FY2015 FY2016 FY2017 FY2018<br />
Description<br />
This source reflects one-time impact fees (latest revision effective 01/01/2012) charged to developers to recover costs associated with<br />
general government activities. This revenue is collected specifically to fund growth related activities. Authorized under A.R.S. 9-463.05 and<br />
city ordinance # 07-24. These revenues are recorded in the general government development impact fee fund.<br />
FY2013<br />
Actuals FY2008 FY2009 FY2010 FY 2011 FY2012 Adopted<br />
Revenue Collected 1,415,217 696,479 724,286 468,620 (245,393) 2,430,100<br />
Forecast Assumptions<br />
The revenue forecast for FY2013 is based on estimates from the Community and Economic Development Department <strong>of</strong> the number <strong>of</strong><br />
single family residential permits issued and the square feet <strong>of</strong> non-single family residential permits issued. The 2014-2016 permits issued for<br />
single family residential permits were based on the conservative forecast estimates in the Elliot Pollack - <strong>City</strong> <strong>of</strong> <strong>Surprise</strong> Economic<br />
Conditons Report dated March 2012. FY2017 single family residential permits issued was a conservative estimate by the Finance dept<br />
based on the growth patterns from the Elliot Pollack Study. Non-single family residential permits include multi-family, <strong>of</strong>fice/institution, and<br />
commercial/customer service. This source has been decreasing due to reduced construction activity from the current recession. CED<br />
estimated FY2013 and years <strong>FY2014</strong>-2017 were conservative estimates done by Finance based on the FY2013 estimate.<br />
Forecast<br />
FY2013<br />
Estimate <strong>FY2014</strong> FY2015 FY2016 FY2017 FY2018<br />
Projected Revenue 559,300 537,400 769,400 1,216,200 1,573,100 1,735,100<br />
Millions<br />
$3.0<br />
$2.5<br />
$2.0<br />
$1.5<br />
$1.0<br />
$0.5<br />
$0.0<br />
($0.5)<br />
FY2008 FY2009 FY2010 FY 2011 FY2012 FY2013<br />
Adopted<br />
36<br />
FY2013<br />
Estimate<br />
<strong>FY2014</strong> FY2015 FY2016 FY2017 FY2018