- Page 1:
AFRICA at a Fork in the Road TAKING
- Page 4 and 5:
Yale Center for the Study of Global
- Page 6 and 7:
Yale Center for the Study of Global
- Page 9 and 10:
Acknowledgements This volume is the
- Page 11:
Africa at a Fork in the Road: Takin
- Page 14 and 15:
Yale Center for the Study of Global
- Page 16 and 17:
Yale Center for the Study of Global
- Page 18 and 19:
Yale Center for the Study of Global
- Page 20 and 21:
Yale Center for the Study of Global
- Page 22 and 23:
Yale Center for the Study of Global
- Page 24 and 25:
Yale Center for the Study of Global
- Page 26 and 27:
Yale Center for the Study of Global
- Page 28 and 29:
Yale Center for the Study of Global
- Page 30 and 31:
Yale Center for the Study of Global
- Page 32 and 33:
Yale Center for the Study of Global
- Page 34 and 35:
Yale Center for the Study of Global
- Page 36 and 37:
Yale Center for the Study of Global
- Page 39 and 40:
2. Africa’s Policy Choices in an
- Page 41 and 42:
Africa at a Fork in the Road: Takin
- Page 43 and 44:
Africa at a Fork in the Road: Takin
- Page 45 and 46:
3. Industrialization: The Good Road
- Page 47 and 48:
Africa at a Fork in the Road: Takin
- Page 49 and 50:
Africa at a Fork in the Road: Takin
- Page 51:
Africa at a Fork in the Road: Takin
- Page 54 and 55:
Yale Center for the Study of Global
- Page 56 and 57:
Yale Center for the Study of Global
- Page 58 and 59:
Yale Center for the Study of Global
- Page 61:
PART II Why Performance Matters: Th
- Page 64 and 65:
Yale Center for the Study of Global
- Page 66 and 67:
Yale Center for the Study of Global
- Page 68 and 69:
Yale Center for the Study of Global
- Page 70 and 71:
Yale Center for the Study of Global
- Page 72 and 73:
Yale Center for the Study of Global
- Page 74 and 75:
Yale Center for the Study of Global
- Page 76 and 77:
Yale Center for the Study of Global
- Page 78 and 79:
Yale Center for the Study of Global
- Page 80 and 81:
Yale Center for the Study of Global
- Page 82 and 83:
Yale Center for the Study of Global
- Page 84 and 85:
Yale Center for the Study of Global
- Page 87 and 88:
6. Inclusive Growth in Africa: Curr
- Page 89 and 90:
Africa at a Fork in the Road: Takin
- Page 91 and 92:
Africa at a Fork in the Road: Takin
- Page 93 and 94:
Africa at a Fork in the Road: Takin
- Page 95 and 96:
Africa at a Fork in the Road: Takin
- Page 97 and 98:
Africa at a Fork in the Road: Takin
- Page 99 and 100:
Africa at a Fork in the Road: Takin
- Page 101 and 102:
Africa at a Fork in the Road: Takin
- Page 103 and 104:
Africa at a Fork in the Road: Takin
- Page 105 and 106:
Africa at a Fork in the Road: Takin
- Page 107 and 108:
Africa at a Fork in the Road: Takin
- Page 109 and 110:
Africa at a Fork in the Road: Takin
- Page 111 and 112:
Africa at a Fork in the Road: Takin
- Page 113 and 114:
Africa at a Fork in the Road: Takin
- Page 115 and 116:
Africa at a Fork in the Road: Takin
- Page 117 and 118:
Africa at a Fork in the Road: Takin
- Page 119:
Africa at a Fork in the Road: Takin
- Page 122 and 123:
Yale Center for the Study of Global
- Page 124 and 125:
Yale Center for the Study of Global
- Page 126 and 127:
Yale Center for the Study of Global
- Page 128 and 129:
Yale Center for the Study of Global
- Page 130 and 131:
Yale Center for the Study of Global
- Page 133 and 134:
8. Avoiding an African Spring: Conf
- Page 135 and 136:
Africa at a Fork in the Road: Takin
- Page 137 and 138:
Africa at a Fork in the Road: Takin
- Page 139 and 140:
Africa at a Fork in the Road: Takin
- Page 141 and 142:
Africa at a Fork in the Road: Takin
- Page 143 and 144:
Africa at a Fork in the Road: Takin
- Page 145 and 146:
9. Africa’s Jobs Challenge Haroon
- Page 147 and 148:
Africa at a Fork in the Road: Takin
- Page 149 and 150:
Africa at a Fork in the Road: Takin
- Page 151 and 152:
Africa at a Fork in the Road: Takin
- Page 153 and 154:
Africa at a Fork in the Road: Takin
- Page 155 and 156:
Africa at a Fork in the Road: Takin
- Page 157 and 158:
Africa at a Fork in the Road: Takin
- Page 159 and 160:
Africa at a Fork in the Road: Takin
- Page 161:
Africa at a Fork in the Road: Takin
- Page 164 and 165:
Yale Center for the Study of Global
- Page 166 and 167:
Yale Center for the Study of Global
- Page 168 and 169:
Yale Center for the Study of Global
- Page 170 and 171:
Yale Center for the Study of Global
- Page 172 and 173:
Yale Center for the Study of Global
- Page 174 and 175:
Yale Center for the Study of Global
- Page 176 and 177:
Yale Center for the Study of Global
- Page 179:
PART III The Governance Factor
- Page 182 and 183:
Yale Center for the Study of Global
- Page 184 and 185:
Yale Center for the Study of Global
- Page 186 and 187:
Yale Center for the Study of Global
- Page 189 and 190:
12. The Political Origins of Africa
- Page 191 and 192:
Africa at a Fork in the Road: Takin
- Page 193 and 194:
Africa at a Fork in the Road: Takin
- Page 195 and 196:
Africa at a Fork in the Road: Takin
- Page 197 and 198:
Africa at a Fork in the Road: Takin
- Page 199 and 200:
Africa at a Fork in the Road: Takin
- Page 201 and 202:
Africa at a Fork in the Road: Takin
- Page 203 and 204:
Africa at a Fork in the Road: Takin
- Page 205 and 206:
Africa at a Fork in the Road: Takin
- Page 207 and 208:
Africa at a Fork in the Road: Takin
- Page 209 and 210:
Africa at a Fork in the Road: Takin
- Page 211 and 212:
Africa at a Fork in the Road: Takin
- Page 213 and 214:
Africa at a Fork in the Road: Takin
- Page 215 and 216:
Africa at a Fork in the Road: Takin
- Page 217 and 218:
Africa at a Fork in the Road: Takin
- Page 219 and 220:
Africa at a Fork in the Road: Takin
- Page 221 and 222:
Africa at a Fork in the Road: Takin
- Page 223 and 224:
Africa at a Fork in the Road: Takin
- Page 225 and 226:
Africa at a Fork in the Road: Takin
- Page 227 and 228:
Africa at a Fork in the Road: Takin
- Page 229 and 230:
Africa at a Fork in the Road: Takin
- Page 231 and 232:
Africa at a Fork in the Road: Takin
- Page 233 and 234:
Africa at a Fork in the Road: Takin
- Page 235 and 236:
Africa at a Fork in the Road: Takin
- Page 237:
Africa at a Fork in the Road: Takin
- Page 240 and 241:
Yale Center for the Study of Global
- Page 242 and 243:
Yale Center for the Study of Global
- Page 244 and 245:
Yale Center for the Study of Global
- Page 246 and 247:
Yale Center for the Study of Global
- Page 248 and 249:
Yale Center for the Study of Global
- Page 250 and 251:
Yale Center for the Study of Global
- Page 252 and 253:
Yale Center for the Study of Global
- Page 254 and 255:
Yale Center for the Study of Global
- Page 256 and 257:
Yale Center for the Study of Global
- Page 258 and 259:
Yale Center for the Study of Global
- Page 261 and 262:
14. Corruption in Africa: Shifting
- Page 263 and 264:
Africa at a Fork in the Road: Takin
- Page 265 and 266:
Africa at a Fork in the Road: Takin
- Page 267 and 268:
Africa at a Fork in the Road: Takin
- Page 269:
Africa at a Fork in the Road: Takin
- Page 272 and 273:
Yale Center for the Study of Global
- Page 274 and 275:
Yale Center for the Study of Global
- Page 276 and 277:
Yale Center for the Study of Global
- Page 279 and 280:
16. Global Value Chains and “Serv
- Page 281 and 282:
Africa at a Fork in the Road: Takin
- Page 283 and 284:
Africa at a Fork in the Road: Takin
- Page 285 and 286:
Africa at a Fork in the Road: Takin
- Page 287 and 288:
Africa at a Fork in the Road: Takin
- Page 289 and 290:
Africa at a Fork in the Road: Takin
- Page 291 and 292:
Africa at a Fork in the Road: Takin
- Page 293 and 294:
Africa at a Fork in the Road: Takin
- Page 295 and 296:
Africa at a Fork in the Road: Takin
- Page 297 and 298:
Africa at a Fork in the Road: Takin
- Page 299 and 300:
Africa at a Fork in the Road: Takin
- Page 301 and 302:
Africa at a Fork in the Road: Takin
- Page 303 and 304:
Africa at a Fork in the Road: Takin
- Page 305 and 306:
Africa at a Fork in the Road: Takin
- Page 307 and 308:
Africa at a Fork in the Road: Takin
- Page 309 and 310:
Africa at a Fork in the Road: Takin
- Page 311 and 312:
Africa at a Fork in the Road: Takin
- Page 313 and 314:
Africa at a Fork in the Road: Takin
- Page 315 and 316:
17. Better Global Governance for a
- Page 317 and 318:
Africa at a Fork in the Road: Takin
- Page 319 and 320:
Africa at a Fork in the Road: Takin
- Page 321 and 322:
Africa at a Fork in the Road: Takin
- Page 323 and 324:
Africa at a Fork in the Road: Takin
- Page 325 and 326:
Africa at a Fork in the Road: Takin
- Page 327 and 328:
Africa at a Fork in the Road: Takin
- Page 329:
Africa at a Fork in the Road: Takin
- Page 332 and 333:
Yale Center for the Study of Global
- Page 334 and 335:
Yale Center for the Study of Global
- Page 336 and 337:
Yale Center for the Study of Global
- Page 338 and 339:
Yale Center for the Study of Global
- Page 341 and 342:
19. The Role of Aid in a Changing A
- Page 343 and 344:
Africa at a Fork in the Road: Takin
- Page 345 and 346:
Africa at a Fork in the Road: Takin
- Page 347 and 348:
Africa at a Fork in the Road: Takin
- Page 349 and 350:
Africa at a Fork in the Road: Takin
- Page 351 and 352: Africa at a Fork in the Road: Takin
- Page 353: PART V Shaping Africa’s Future
- Page 356 and 357: Yale Center for the Study of Global
- Page 358 and 359: Yale Center for the Study of Global
- Page 360 and 361: Yale Center for the Study of Global
- Page 362 and 363: Yale Center for the Study of Global
- Page 365 and 366: 21. Past the Resource Curse: The
- Page 367 and 368: Africa at a Fork in the Road: Takin
- Page 369 and 370: Africa at a Fork in the Road: Takin
- Page 371: Africa at a Fork in the Road: Takin
- Page 374 and 375: Yale Center for the Study of Global
- Page 376 and 377: Yale Center for the Study of Global
- Page 378 and 379: Yale Center for the Study of Global
- Page 380 and 381: A main improvement has involved eco
- Page 382 and 383: Yale Center for the Study of Global
- Page 384 and 385: Yale Center for the Study of Global
- Page 386 and 387: Yale Center for the Study of Global
- Page 388 and 389: Yale Center for the Study of Global
- Page 390 and 391: Yale Center for the Study of Global
- Page 392 and 393: Yale Center for the Study of Global
- Page 395 and 396: 23. Foreign Direct Investment, Natu
- Page 397 and 398: Africa at a Fork in the Road: Takin
- Page 399 and 400: Africa at a Fork in the Road: Takin
- Page 401: Africa at a Fork in the Road: Takin
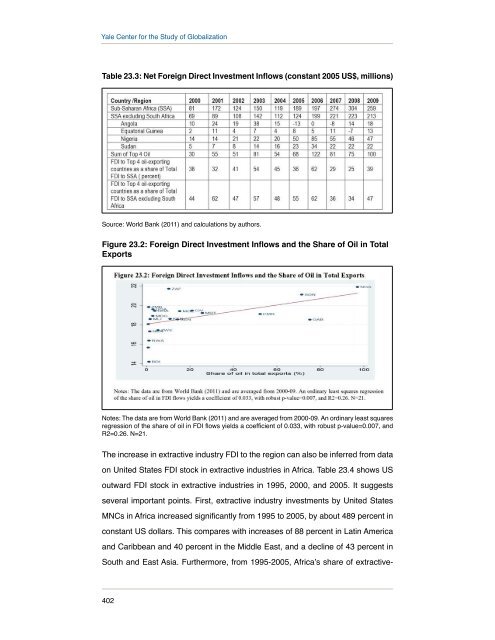
- Page 405 and 406: Africa at a Fork in the Road: Takin
- Page 407 and 408: Africa at a Fork in the Road: Takin
- Page 409 and 410: Africa at a Fork in the Road: Takin
- Page 411 and 412: Africa at a Fork in the Road: Takin
- Page 413 and 414: Africa at a Fork in the Road: Takin
- Page 415 and 416: 24. Tanzania: Turning Natural Gas i
- Page 417 and 418: Africa at a Fork in the Road: Takin
- Page 419 and 420: Africa at a Fork in the Road: Takin
- Page 421 and 422: Africa at a Fork in the Road: Takin
- Page 423 and 424: Africa at a Fork in the Road: Takin
- Page 425 and 426: Africa at a Fork in the Road: Takin
- Page 427 and 428: Africa at a Fork in the Road: Takin
- Page 429 and 430: Africa at a Fork in the Road: Takin
- Page 431 and 432: Africa at a Fork in the Road: Takin
- Page 433: Africa at a Fork in the Road: Takin
- Page 436 and 437: Yale Center for the Study of Global
- Page 438 and 439: Yale Center for the Study of Global
- Page 440 and 441: Yale Center for the Study of Global
- Page 442 and 443: Yale Center for the Study of Global
- Page 444 and 445: Yale Center for the Study of Global
- Page 446 and 447: Yale Center for the Study of Global
- Page 448 and 449: Yale Center for the Study of Global
- Page 450 and 451: Yale Center for the Study of Global
- Page 452 and 453:
Yale Center for the Study of Global
- Page 454 and 455:
Yale Center for the Study of Global
- Page 456 and 457:
Yale Center for the Study of Global
- Page 458 and 459:
Yale Center for the Study of Global
- Page 460 and 461:
Yale Center for the Study of Global
- Page 462 and 463:
Yale Center for the Study of Global
- Page 464 and 465:
Yale Center for the Study of Global
- Page 466 and 467:
26.5 Moving forward Africa’s mixe
- Page 468 and 469:
Yale Center for the Study of Global
- Page 470 and 471:
Yale Center for the Study of Global
- Page 473 and 474:
27. Smallholders Hold the Keys to A
- Page 475 and 476:
Africa at a Fork in the Road: Takin
- Page 477 and 478:
Africa at a Fork in the Road: Takin
- Page 479 and 480:
Africa at a Fork in the Road: Takin
- Page 481 and 482:
Africa at a Fork in the Road: Takin
- Page 483:
Africa at a Fork in the Road: Takin
- Page 486 and 487:
Yale Center for the Study of Global
- Page 488 and 489:
Yale Center for the Study of Global
- Page 490 and 491:
Yale Center for the Study of Global
- Page 492 and 493:
Yale Center for the Study of Global
- Page 494 and 495:
Yale Center for the Study of Global
- Page 496 and 497:
Yale Center for the Study of Global
- Page 498 and 499:
Yale Center for the Study of Global
- Page 500 and 501:
Yale Center for the Study of Global
- Page 502 and 503:
Yale Center for the Study of Global
- Page 504 and 505:
Yale Center for the Study of Global
- Page 506 and 507:
Yale Center for the Study of Global
- Page 508 and 509:
Yale Center for the Study of Global
- Page 510 and 511:
Yale Center for the Study of Global
- Page 512 and 513:
Yale Center for the Study of Global
- Page 514 and 515:
Yale Center for the Study of Global
- Page 516 and 517:
Yale Center for the Study of Global
- Page 518 and 519:
Yale Center for the Study of Global
- Page 520 and 521:
Yale Center for the Study of Global
- Page 522 and 523:
Yale Center for the Study of Global
- Page 524 and 525:
Yale Center for the Study of Global
- Page 526 and 527:
Yale Center for the Study of Global
- Page 528 and 529:
Yale Center for the Study of Global
- Page 530 and 531:
Yale Center for the Study of Global
- Page 532 and 533:
Yale Center for the Study of Global
- Page 534 and 535:
Yale Center for the Study of Global