The <str<strong>on</strong>g>12th</str<strong>on</strong>g> <str<strong>on</strong>g>Internati<strong>on</strong>al</str<strong>on</strong>g> <str<strong>on</strong>g>Symposium</str<strong>on</strong>g> <strong>on</strong> <strong>District</strong> <strong>Heating</strong> <strong>and</strong> <strong>Cooling</strong>,September 5 th to September 7 th , 2010, Tallinn, Est<strong>on</strong>iaEFFECTIVE WIDTHEffective width is a measure indicating the districtheating network extensi<strong>on</strong> level within a given l<strong>and</strong>area. The quantity effective width, which is symbolisedby use of the letter w, with the unit metres, expressesthe ratio between l<strong>and</strong> area <strong>and</strong> the total trench lengthof the distributi<strong>on</strong> network within a district heatingsystem [3]w = A L / L [m] (1)Being in this way the result of explicit area <strong>and</strong> gridproperties, effective width can be used to describetypical district heating properties in different populati<strong>on</strong>density areas <strong>and</strong> hence, give informati<strong>on</strong> <strong>on</strong>prerequisite c<strong>on</strong>diti<strong>on</strong>s for future district heatestablishments.THE CONCEPTIn order to introduce the c<strong>on</strong>cept of effective width, it isnecessary to first underst<strong>and</strong> some basic principalsregarding the linear heat density. The c<strong>on</strong>cept of linearheat density, being the divisi<strong>on</strong> of total annually soldheat in a district heating system <strong>and</strong> the total length ofthe district heating piping network, indicates the level ofdistrict heat distributi<strong>on</strong> system utilisati<strong>on</strong>. Furthermore,linear heat density is a denominator parameter whencalculating district heating network capital costs.p = P/A L [number/m 2 ] (7)α = A B /P [m 2 /capita] (8)P = Total populati<strong>on</strong>A L = Total l<strong>and</strong> area [m 2 ]A B = Total building space area [m 2 ][number]The c<strong>on</strong>cept of effective width hereby plays a key rolein the reformulati<strong>on</strong> of the traditi<strong>on</strong>al expressi<strong>on</strong> forlinear heat density, <strong>and</strong> hence, c<strong>on</strong>stitutes a centralquantity in model estimati<strong>on</strong>s of the feasibility <strong>and</strong>viability of future district heating network. If linear heatdensity can be said to indicate the level of district heatdistributi<strong>on</strong> system utilisati<strong>on</strong>, the effective widthindicates the distributi<strong>on</strong> system coverage of the l<strong>and</strong>area at h<strong>and</strong>.THE PROBLEMFrom a district heating distributi<strong>on</strong> point of view it isrelevant to distinguish between two kinds of l<strong>and</strong> arealow plot ratio situati<strong>on</strong>s. The l<strong>and</strong> areas can, principally,c<strong>on</strong>sist of either a wide dispersi<strong>on</strong> of householdsspread out over the whole area (A), or households canbe closely limited to <strong>on</strong>ly a fracti<strong>on</strong> of the l<strong>and</strong> area (B),see figure 1.LinearHeatDensityQs [GJ/m] (2)LAs has been put out in [2], this traditi<strong>on</strong>al presentati<strong>on</strong>of the c<strong>on</strong>cept of linear heat density offers ―no entrancefor estimati<strong>on</strong>s of future district heating systems, sincen<strong>on</strong>e of the two quantities can be known for yet notbuilt systems‖, which is the fundamental reas<strong>on</strong> forreformulati<strong>on</strong> of the expressi<strong>on</strong> by use of demographicquantities. If combining the two c<strong>on</strong>cepts of populati<strong>on</strong>density (p) <strong>and</strong> specific building space (α) into the cityplanning quantity plot ratio (e), which is suggested in[2], the c<strong>on</strong>cept of linear heat density can bealternatively expressed as;Q sLq e w [GJ/m] (3)The three new parameters, specific heat dem<strong>and</strong> (q),plot ratio (e) <strong>and</strong> effective width (w), are defined as:q = Q/A B [GJ/m 2 a] (4)e = p α [1] (5)w = A L /L [m] (6)where129Figure 1. Low plot ratio l<strong>and</strong> areas, scenario A with widedispersi<strong>on</strong> of buildings <strong>and</strong> scenario B with highc<strong>on</strong>centrati<strong>on</strong> of buildings.In the first case (A), a district heating distributi<strong>on</strong> gridwould have to cover all of the l<strong>and</strong> area at h<strong>and</strong> inorder to deliver heat (at very low linear heat density),while in the latter case (B), the grid could be narroweddown to the limited area fracti<strong>on</strong>. If, when c<strong>on</strong>ductingdistrict heating feasibility model analysis, plot ratios areextracted by means of (5), it would be relevant <strong>and</strong>recommended to somehow adjust the l<strong>and</strong> areamagnitude in order not to include n<strong>on</strong>-targeted areafracti<strong>on</strong>s. An adjustment to reach this purpose can beachieved in several different ways, of which EffectiveWidth compensati<strong>on</strong> suggested in this paper is <strong>on</strong>eopti<strong>on</strong>.
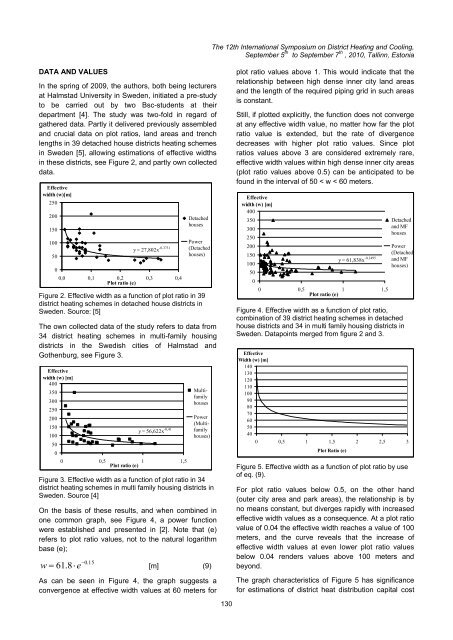
DATA AND VALUESIn the spring of 2009, the authors, both being lecturersat Halmstad University in Sweden, initiated a pre-studyto be carried out by two Bsc-students at theirdepartment [4]. The study was two-fold in regard ofgathered data. Partly it delivered previously assembled<strong>and</strong> crucial data <strong>on</strong> plot ratios, l<strong>and</strong> areas <strong>and</strong> trenchlengths in 39 detached house districts heating schemesin Sweden [5], allowing estimati<strong>on</strong>s of effective widthsin these districts, see Figure 2, <strong>and</strong> partly own collecteddata.Effectivewidth (w)[m]250200150100500y = 27,802x -0,37310,0 0,1 0,2 0,3 0,4Plot ratio (e)DetachedhousesPower(Detachedhouses)Figure 2. Effective width as a functi<strong>on</strong> of plot ratio in 39district heating schemes in detached house districts inSweden. Source: [5]The own collected data of the study refers to data from34 district heating schemes in multi-family housingdistricts in the Swedish cities of Halmstad <strong>and</strong>Gothenburg, see Figure 3.Effectivewidth (w) [m]400350300250200150100500y = 56,622x -0,410 0,5 1 1,5Plot ratio (e)MultifamilyhousesPower(Multifamilyhouses)Figure 3. Effective width as a functi<strong>on</strong> of plot ratio in 34district heating schemes in multi family housing districts inSweden. Source [4]On the basis of these results, <strong>and</strong> when combined in<strong>on</strong>e comm<strong>on</strong> graph, see Figure 4, a power functi<strong>on</strong>were established <strong>and</strong> presented in [2]. Note that (e)refers to plot ratio values, not to the natural logarithmbase (e);0.15w 61.8 e[m] (9)As can be seen in Figure 4, the graph suggests ac<strong>on</strong>vergence at effective width values at 60 meters forThe <str<strong>on</strong>g>12th</str<strong>on</strong>g> <str<strong>on</strong>g>Internati<strong>on</strong>al</str<strong>on</strong>g> <str<strong>on</strong>g>Symposium</str<strong>on</strong>g> <strong>on</strong> <strong>District</strong> <strong>Heating</strong> <strong>and</strong> <strong>Cooling</strong>,September 5 th to September 7 th , 2010, Tallinn, Est<strong>on</strong>ia130plot ratio values above 1. This would indicate that therelati<strong>on</strong>ship between high dense inner city l<strong>and</strong> areas<strong>and</strong> the length of the required piping grid in such areasis c<strong>on</strong>stant.Still, if plotted explicitly, the functi<strong>on</strong> does not c<strong>on</strong>vergeat any effective width value, no matter how far the plotratio value is extended, but the rate of divergencedecreases with higher plot ratio values. Since plotratios values above 3 are c<strong>on</strong>sidered extremely rare,effective width values within high dense inner city areas(plot ratio values above 0.5) can be anticipated to befound in the interval of 50 < w < 60 meters.Effectivewidth (w) [m]400350300250200150100500y = 61,838x -0,14950 0,5 1 1,5Plot ratio (e)Detached<strong>and</strong> MFhousesPower(Detached<strong>and</strong> MFhouses)Figure 4. Effective width as a functi<strong>on</strong> of plot ratio,combinati<strong>on</strong> of 39 district heating schemes in detachedhouse districts <strong>and</strong> 34 in multi family housing districts inSweden. Datapoints merged from figure 2 <strong>and</strong> 3.EffectiveWidth (w) [m]1401301201101009080706050400 0,5 1 1,5 2 2,5 3Plot Ratio (e)Figure 5. Effective width as a functi<strong>on</strong> of plot ratio by useof eq. (9).For plot ratio values below 0.5, <strong>on</strong> the other h<strong>and</strong>(outer city area <strong>and</strong> park areas), the relati<strong>on</strong>ship is byno means c<strong>on</strong>stant, but diverges rapidly with increasedeffective width values as a c<strong>on</strong>sequence. At a plot ratiovalue of 0.04 the effective width reaches a value of 100meters, <strong>and</strong> the curve reveals that the increase ofeffective width values at even lower plot ratio valuesbelow 0.04 renders values above 100 meters <strong>and</strong>bey<strong>on</strong>d.The graph characteristics of Figure 5 has significancefor estimati<strong>on</strong>s of district heat distributi<strong>on</strong> capital cost
- Page 1:
12th Inter
- Page 5 and 6:
The 12th I
- Page 7 and 8:
The 12th I
- Page 10 and 11:
The 12th I
- Page 12 and 13:
The 12th I
- Page 14 and 15:
For the case of parallel buried pip
- Page 16 and 17:
The 12th I
- Page 18 and 19:
The 12th I
- Page 20 and 21:
The 12th I
- Page 22 and 23:
The 12th I
- Page 24 and 25:
The 12th I
- Page 26 and 27:
The 12th I
- Page 28 and 29:
The 12th I
- Page 30 and 31:
The 12th I
- Page 32 and 33:
The 12th I
- Page 34 and 35:
The 12th I
- Page 36 and 37:
The 12th I
- Page 38 and 39:
The 12th I
- Page 40 and 41:
The 12th I
- Page 42 and 43:
The 12th I
- Page 44 and 45:
The 12th I
- Page 46 and 47:
The 12th I
- Page 48 and 49:
The 12th I
- Page 50 and 51:
The 12th I
- Page 52 and 53:
The 12th I
- Page 54 and 55:
The 12th I
- Page 56 and 57:
The 12th I
- Page 58 and 59:
The 12th I
- Page 60 and 61:
The 12th I
- Page 62 and 63:
The 12th I
- Page 64 and 65:
The 12th I
- Page 66 and 67:
The 12th I
- Page 68 and 69:
The 12th I
- Page 70 and 71:
The 12th I
- Page 72 and 73:
The 12th I
- Page 74 and 75:
The 12th I
- Page 76 and 77:
The 12th I
- Page 78 and 79:
The 12th I
- Page 80 and 81: The 12th I
- Page 82 and 83: The 12th I
- Page 84 and 85: The 12th I
- Page 86 and 87: The 12th I
- Page 88 and 89: The 12th I
- Page 90 and 91: The 12th I
- Page 92 and 93: The 12th I
- Page 94 and 95: The 12th I
- Page 96 and 97: The 12th I
- Page 98 and 99: the street the more shallow the sha
- Page 100 and 101: The 12th I
- Page 102 and 103: The 12th I
- Page 104 and 105: The 12th I
- Page 106 and 107: The 12th I
- Page 108 and 109: The 12th I
- Page 110 and 111: P-1P-4P-9P-7E-5P-14P-8The 1
- Page 112 and 113: The 12th I
- Page 114 and 115: The 12th I
- Page 116 and 117: The 12th I
- Page 118 and 119: The 12th I
- Page 120 and 121: The 12th I
- Page 122 and 123: The 12th I
- Page 124 and 125: The 12th I
- Page 126 and 127: The 12th I
- Page 128 and 129: The 12th I
- Page 132 and 133: The 12th I
- Page 134 and 135: The 12th I
- Page 136 and 137: The 12th I
- Page 138 and 139: to heating costs of 14,5 ct/kWh. Th
- Page 140 and 141: The 12th I
- Page 142 and 143: The 12th I
- Page 144 and 145: The 12th I
- Page 146 and 147: The 12th I
- Page 148 and 149: academic access is facilitated as t
- Page 150 and 151: The 12th I
- Page 152 and 153: The 12th I
- Page 154 and 155: The 12th I
- Page 156 and 157: The 12th I
- Page 158 and 159: The 12th I
- Page 160 and 161: The 12th I
- Page 162 and 163: 1. CHP system operation in A2. Ther
- Page 164 and 165: The 12th I
- Page 166 and 167: is covered by operating HOB. In oth
- Page 168 and 169: The 12th I
- Page 170 and 171: The 12th I
- Page 172 and 173: The 12th I
- Page 174 and 175: The 12th I
- Page 176 and 177: The 12th I
- Page 178 and 179: The 12th I
- Page 180 and 181:
The 12th I
- Page 182 and 183:
The 12th I
- Page 184 and 185:
The 12th I
- Page 186 and 187:
The 12th I
- Page 188 and 189:
The 12th I
- Page 190 and 191:
The 12th I
- Page 192 and 193:
The 12th I
- Page 194 and 195:
The 12th I
- Page 196 and 197:
produce heat and electricity. Fluct
- Page 198 and 199:
The 12th I
- Page 200 and 201:
The 12th I
- Page 202 and 203:
The 12th I
- Page 204 and 205:
The 12th I
- Page 206 and 207:
The 12th I
- Page 208 and 209:
The 12th I
- Page 210 and 211:
To assure that the temperatures mea
- Page 212 and 213:
The 12th I
- Page 214 and 215:
The 12th I
- Page 216 and 217:
The 12th I
- Page 218 and 219:
The 12th I
- Page 220 and 221:
production and provide for marginal
- Page 222 and 223:
The 12th I
- Page 224 and 225:
The 12th I
- Page 226 and 227:
The 12th I
- Page 228 and 229:
The 12th I
- Page 230 and 231:
The 12th I
- Page 232 and 233:
The 12th I
- Page 234 and 235:
The 12th I
- Page 236 and 237:
The 12th I
- Page 238 and 239:
The 12th I
- Page 240 and 241:
The 12th I
- Page 242 and 243:
In addition, it can also be observe
- Page 244 and 245:
The 12th I
- Page 246 and 247:
owner is normally only interested i
- Page 248 and 249:
The 12th I
- Page 250 and 251:
The 12th I
- Page 252 and 253:
The 12th I
- Page 254 and 255:
The 12th I
- Page 256 and 257:
The 12th I
- Page 258 and 259:
The 12th I
- Page 260 and 261:
The 12th I
- Page 262 and 263:
The 12th I
- Page 264 and 265:
The 12th I
- Page 266 and 267:
The 12th I
- Page 268 and 269:
The 12th I
- Page 270 and 271:
The 12th I
- Page 272 and 273:
The 12th I
- Page 274 and 275:
The 12th I
- Page 276 and 277:
The 12th I
- Page 278 and 279:
The 12th I
- Page 280 and 281:
The 12th I
- Page 282 and 283:
The 12th I
- Page 284 and 285:
The 12th I
- Page 286 and 287:
The 12th I
- Page 288 and 289:
The 12th I
- Page 290 and 291:
Stockholm district heating system a
- Page 292 and 293:
The 12th I
- Page 294 and 295:
The 12th I
- Page 296 and 297:
The 12th I
- Page 298 and 299:
The 12th I
- Page 300 and 301:
The 12th I
- Page 302 and 303:
The 12th I
- Page 304 and 305:
The 12th I
- Page 306 and 307:
The 12th I
- Page 308 and 309:
The 12th I
- Page 310 and 311:
The 12th I
- Page 312 and 313:
The 12th I
- Page 314 and 315:
The values presented do of course l
- Page 316 and 317:
The 12th I
- Page 318 and 319:
The 12th I
- Page 320 and 321:
The 12th I
- Page 322 and 323:
The 12th I
- Page 324 and 325:
The 12th I
- Page 326:
The 12th I