The <str<strong>on</strong>g>12th</str<strong>on</strong>g> <str<strong>on</strong>g>Internati<strong>on</strong>al</str<strong>on</strong>g> <str<strong>on</strong>g>Symposium</str<strong>on</strong>g> <strong>on</strong> <strong>District</strong> <strong>Heating</strong> <strong>and</strong> <strong>Cooling</strong>,September 5 th to September 7 th , 2010, Tallinn, Est<strong>on</strong>iaANALYSIS OF HEAT TRANSFER IN HEAT EXCHANGERS BY USINGTHE NTU METHOD AND EMPIRICAL RELATIONSO. Gudmundss<strong>on</strong>, O. P. Palss<strong>on</strong> <strong>and</strong> H. Palss<strong>on</strong> 1Faculty of Industrial Engineering, Mechanical Engineering <strong>and</strong> ComputerScience Hjardarhagi 2-6, IS-107 Reykjavik, Icel<strong>and</strong>ABSTRACTHeat exchangers are widely used in domestic <strong>and</strong>industrial applicati<strong>on</strong>s involving transfer of energy from<strong>on</strong>e fluid to another, for example in district heatingsystems. The wide usage underlines the importance tohave a good technique to detect if the effectiveness ofan heat exchanger is diminishing. There are number ofthings that can cause diminishing effectiveness of anheat exchanger, for example fouling, changes in fluidproperties as well as corrosi<strong>on</strong>. In many cases thefouling is a particular problem, for example whengeothermal water is used. Geothermal water is verymineral rich which can cause serious fouling problems.The method presented in this paper is simple <strong>and</strong> easyto use <strong>and</strong> can be used to detect a diminishing heattransfer coefficient in many types of heat exchangers,in this paper the method is used <strong>on</strong> cross flow heatexchanger. The method uses measurements of theinlet <strong>and</strong> outlet temperatures as well as the mass flows,these measurements are usually easy to gather undernormal operati<strong>on</strong>. The method uses the well knownNumber of Transfer Units (NTU) method as well asempirical relati<strong>on</strong>s to estimate the overall heat transfercoefficient, which is then statistically analyzed. Thedata used in this study was gathered from a simulatedcross-flow heat exchanger where the overall heattransfer coefficient was gradually decreased tosimulate diminishing effectiveness of the heatexchanger. The c<strong>on</strong>clusi<strong>on</strong> of this study shows that thederived detecti<strong>on</strong> method can detect fouling based <strong>on</strong>the data from a simulated cross-flow heat exchanger,with a good accuracy <strong>and</strong> c<strong>on</strong>sistency. Further analysis<strong>on</strong> real data is scheduled.INTRODUCTIONHeat exchangers are widely used in domestic <strong>and</strong>industrial applicati<strong>on</strong>s involving transfer of energy from<strong>on</strong>e fluid to another. General classificati<strong>on</strong> of heatexchangers are parallel flow, counter flow <strong>and</strong> crossflow. Their size <strong>and</strong> complexity can also vary greatly.Their operating c<strong>on</strong>diti<strong>on</strong>s can be classified into twomain classes, steady operati<strong>on</strong> where mass flow <strong>and</strong>temperatures are relatively c<strong>on</strong>stant <strong>and</strong> dynamicoperati<strong>on</strong> where mass flow <strong>and</strong> temperatures can varygreatly with time.During operati<strong>on</strong> it is important to have someknowledge of the c<strong>on</strong>diti<strong>on</strong> of the heat exchanger. Fora steady state c<strong>on</strong>diti<strong>on</strong> it has proven to be relativelysimple, since analytical <strong>and</strong> empirical relati<strong>on</strong>s can bederived for different heat exchanger types <strong>and</strong> used forall necessary calculati<strong>on</strong> regarding time invariantc<strong>on</strong>diti<strong>on</strong>s, see e.g. [1]. If a dynamic operati<strong>on</strong> exists itbecomes more complex to m<strong>on</strong>itor the c<strong>on</strong>diti<strong>on</strong> of theheat exchanger <strong>and</strong> more complex models are used,see e.g. [2] <strong>and</strong> [3].In this study, a mathematical model is used that hasbeen developed to simulate accurately the temperature<strong>and</strong> flow transients in a cross flow heat exchanger. Themodel is based <strong>on</strong> the finite volume method (FVM)where a mathematical representati<strong>on</strong> of a generalcross flow heat exchanger is solved numerically. Onepossible applicati<strong>on</strong> of such a model is to generatedata that can be used to compare <strong>and</strong> tune moresimple dynamic models based <strong>on</strong> either black boxmethods or state space modelling. An importantapplicati<strong>on</strong> in this c<strong>on</strong>text involves methods to detectfouling in heat exchangers under dynamic operati<strong>on</strong>.Descripti<strong>on</strong> of the model can be seen in [4].Fouling in heat exchanger can be categorized in thefollowing categories, precipitati<strong>on</strong> fouling, chemicalreacti<strong>on</strong> fouling, corrosi<strong>on</strong> fouling, particulate fouling,biological fouling <strong>and</strong> freezing fouling. Usually fouling isa combinati<strong>on</strong> of the categories. The fouling process inheat exchanger can be described as a process wherethe separating metal inside the heat exchangeraccumulates deposits from the fluids. This is verycomm<strong>on</strong> <strong>and</strong> poses problems <strong>and</strong> results in reducedefficiency of the heat exchangers. There are numerousmethods available to address the effect of fouling, see[5–8]. Finally, decrease in the thermal efficiency of aheat exchanger due to property changes in a workingfluid will have similar effect <strong>on</strong> the heat exchanger asfouling.There are number of ways to detect fouling butaccording to [9], classical methods involvea) examinati<strong>on</strong> of the heat transfer coefficient,b) simultaneous observati<strong>on</strong>s of pressure drops <strong>and</strong>mass flow rates, c) temperature measurements,d) ultras<strong>on</strong>ic or electrical measurements <strong>and</strong>e) weighing of the heat exchanger plates. Methodsa–c) require the heat exchanger to be operating insteady state c<strong>on</strong>diti<strong>on</strong>, d) can <strong>on</strong>ly m<strong>on</strong>itor local fouling<strong>and</strong> e) requires the process to be stopped. Theserestricti<strong>on</strong>s can be too strict or costly. Another305
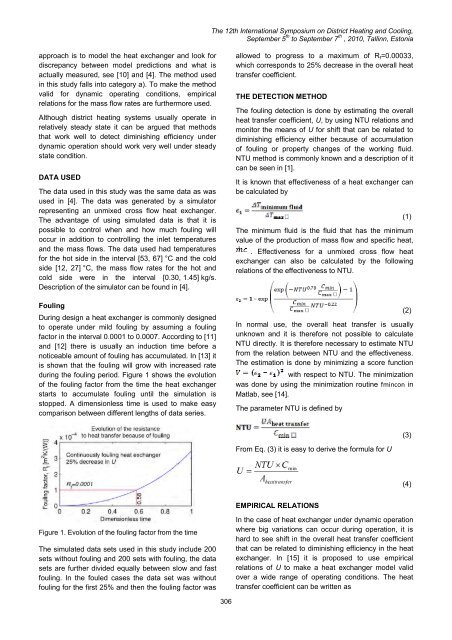
The <str<strong>on</strong>g>12th</str<strong>on</strong>g> <str<strong>on</strong>g>Internati<strong>on</strong>al</str<strong>on</strong>g> <str<strong>on</strong>g>Symposium</str<strong>on</strong>g> <strong>on</strong> <strong>District</strong> <strong>Heating</strong> <strong>and</strong> <strong>Cooling</strong>,September 5 th to September 7 th , 2010, Tallinn, Est<strong>on</strong>iaapproach is to model the heat exchanger <strong>and</strong> look fordiscrepancy between model predicti<strong>on</strong>s <strong>and</strong> what isactually measured, see [10] <strong>and</strong> [4]. The method usedin this study falls into category a). To make the methodvalid for dynamic operating c<strong>on</strong>diti<strong>on</strong>s, empiricalrelati<strong>on</strong>s for the mass flow rates are furthermore used.Although district heating systems usually operate inrelatively steady state it can be argued that methodsthat work well to detect diminishing efficiency underdynamic operati<strong>on</strong> should work very well under steadystate c<strong>on</strong>diti<strong>on</strong>.DATA USEDThe data used in this study was the same data as wasused in [4]. The data was generated by a simulatorrepresenting an unmixed cross flow heat exchanger.The advantage of using simulated data is that it ispossible to c<strong>on</strong>trol when <strong>and</strong> how much fouling willoccur in additi<strong>on</strong> to c<strong>on</strong>trolling the inlet temperatures<strong>and</strong> the mass flows. The data used had temperaturesfor the hot side in the interval [53, 67] °C <strong>and</strong> the coldside [12, 27] °C, the mass flow rates for the hot <strong>and</strong>cold side were in the interval [0.30, 1.45] kg/s.Descripti<strong>on</strong> of the simulator can be found in [4].FoulingDuring design a heat exchanger is comm<strong>on</strong>ly designedto operate under mild fouling by assuming a foulingfactor in the interval 0.0001 to 0.0007. According to [11]<strong>and</strong> [12] there is usually an inducti<strong>on</strong> time before anoticeable amount of fouling has accumulated. In [13] itis shown that the fouling will grow with increased rateduring the fouling period. Figure 1 shows the evoluti<strong>on</strong>of the fouling factor from the time the heat exchangerstarts to accumulate fouling until the simulati<strong>on</strong> isstopped. A dimensi<strong>on</strong>less time is used to make easycomparis<strong>on</strong> between different lengths of data series.allowed to progress to a maximum of R f =0.00033,which corresp<strong>on</strong>ds to 25% decrease in the overall heattransfer coefficient.THE DETECTION METHODThe fouling detecti<strong>on</strong> is d<strong>on</strong>e by estimating the overallheat transfer coefficient, U, by using NTU relati<strong>on</strong>s <strong>and</strong>m<strong>on</strong>itor the means of U for shift that can be related todiminishing efficiency either because of accumulati<strong>on</strong>of fouling or property changes of the working fluid.NTU method is comm<strong>on</strong>ly known <strong>and</strong> a descripti<strong>on</strong> of itcan be seen in [1].It is known that effectiveness of a heat exchanger canbe calculated byThe minimum fluid is the fluid that has the minimumvalue of the producti<strong>on</strong> of mass flow <strong>and</strong> specific heat,. Effectiveness for a unmixed cross flow heatexchanger can also be calculated by the followingrelati<strong>on</strong>s of the effectiveness to NTU.In normal use, the overall heat transfer is usuallyunknown <strong>and</strong> it is therefore not possible to calculateNTU directly. It is therefore necessary to estimate NTUfrom the relati<strong>on</strong> between NTU <strong>and</strong> the effectiveness.The estimati<strong>on</strong> is d<strong>on</strong>e by minimizing a score functi<strong>on</strong>with respect to NTU. The minimizati<strong>on</strong>was d<strong>on</strong>e by using the minimizati<strong>on</strong> routine fminc<strong>on</strong> inMatlab, see [14].The parameter NTU is defined by(1)(2)(3)From Eq. (3) it is easy to derive the formula for U(4)EMPIRICAL RELATIONSFigure 1. Evoluti<strong>on</strong> of the fouling factor from the timeThe simulated data sets used in this study include 200sets without fouling <strong>and</strong> 200 sets with fouling, the datasets are further divided equally between slow <strong>and</strong> fastfouling. In the fouled cases the data set was withoutfouling for the first 25% <strong>and</strong> then the fouling factor wasIn the case of heat exchanger under dynamic operati<strong>on</strong>where big variati<strong>on</strong>s can occur during operati<strong>on</strong>, it ishard to see shift in the overall heat transfer coefficientthat can be related to diminishing efficiency in the heatexchanger. In [15] it is proposed to use empiricalrelati<strong>on</strong>s of U to make a heat exchanger model validover a wide range of operating c<strong>on</strong>diti<strong>on</strong>s. The heattransfer coefficient can be written as306
- Page 1:
12th Inter
- Page 5 and 6:
The 12th I
- Page 7 and 8:
The 12th I
- Page 10 and 11:
The 12th I
- Page 12 and 13:
The 12th I
- Page 14 and 15:
For the case of parallel buried pip
- Page 16 and 17:
The 12th I
- Page 18 and 19:
The 12th I
- Page 20 and 21:
The 12th I
- Page 22 and 23:
The 12th I
- Page 24 and 25:
The 12th I
- Page 26 and 27:
The 12th I
- Page 28 and 29:
The 12th I
- Page 30 and 31:
The 12th I
- Page 32 and 33:
The 12th I
- Page 34 and 35:
The 12th I
- Page 36 and 37:
The 12th I
- Page 38 and 39:
The 12th I
- Page 40 and 41:
The 12th I
- Page 42 and 43:
The 12th I
- Page 44 and 45:
The 12th I
- Page 46 and 47:
The 12th I
- Page 48 and 49:
The 12th I
- Page 50 and 51:
The 12th I
- Page 52 and 53:
The 12th I
- Page 54 and 55:
The 12th I
- Page 56 and 57:
The 12th I
- Page 58 and 59:
The 12th I
- Page 60 and 61:
The 12th I
- Page 62 and 63:
The 12th I
- Page 64 and 65:
The 12th I
- Page 66 and 67:
The 12th I
- Page 68 and 69:
The 12th I
- Page 70 and 71:
The 12th I
- Page 72 and 73:
The 12th I
- Page 74 and 75:
The 12th I
- Page 76 and 77:
The 12th I
- Page 78 and 79:
The 12th I
- Page 80 and 81:
The 12th I
- Page 82 and 83:
The 12th I
- Page 84 and 85:
The 12th I
- Page 86 and 87:
The 12th I
- Page 88 and 89:
The 12th I
- Page 90 and 91:
The 12th I
- Page 92 and 93:
The 12th I
- Page 94 and 95:
The 12th I
- Page 96 and 97:
The 12th I
- Page 98 and 99:
the street the more shallow the sha
- Page 100 and 101:
The 12th I
- Page 102 and 103:
The 12th I
- Page 104 and 105:
The 12th I
- Page 106 and 107:
The 12th I
- Page 108 and 109:
The 12th I
- Page 110 and 111:
P-1P-4P-9P-7E-5P-14P-8The 1
- Page 112 and 113:
The 12th I
- Page 114 and 115:
The 12th I
- Page 116 and 117:
The 12th I
- Page 118 and 119:
The 12th I
- Page 120 and 121:
The 12th I
- Page 122 and 123:
The 12th I
- Page 124 and 125:
The 12th I
- Page 126 and 127:
The 12th I
- Page 128 and 129:
The 12th I
- Page 130 and 131:
The 12th I
- Page 132 and 133:
The 12th I
- Page 134 and 135:
The 12th I
- Page 136 and 137:
The 12th I
- Page 138 and 139:
to heating costs of 14,5 ct/kWh. Th
- Page 140 and 141:
The 12th I
- Page 142 and 143:
The 12th I
- Page 144 and 145:
The 12th I
- Page 146 and 147:
The 12th I
- Page 148 and 149:
academic access is facilitated as t
- Page 150 and 151:
The 12th I
- Page 152 and 153:
The 12th I
- Page 154 and 155:
The 12th I
- Page 156 and 157:
The 12th I
- Page 158 and 159:
The 12th I
- Page 160 and 161:
The 12th I
- Page 162 and 163:
1. CHP system operation in A2. Ther
- Page 164 and 165:
The 12th I
- Page 166 and 167:
is covered by operating HOB. In oth
- Page 168 and 169:
The 12th I
- Page 170 and 171:
The 12th I
- Page 172 and 173:
The 12th I
- Page 174 and 175:
The 12th I
- Page 176 and 177:
The 12th I
- Page 178 and 179:
The 12th I
- Page 180 and 181:
The 12th I
- Page 182 and 183:
The 12th I
- Page 184 and 185:
The 12th I
- Page 186 and 187:
The 12th I
- Page 188 and 189:
The 12th I
- Page 190 and 191:
The 12th I
- Page 192 and 193:
The 12th I
- Page 194 and 195:
The 12th I
- Page 196 and 197:
produce heat and electricity. Fluct
- Page 198 and 199:
The 12th I
- Page 200 and 201:
The 12th I
- Page 202 and 203:
The 12th I
- Page 204 and 205:
The 12th I
- Page 206 and 207:
The 12th I
- Page 208 and 209:
The 12th I
- Page 210 and 211:
To assure that the temperatures mea
- Page 212 and 213:
The 12th I
- Page 214 and 215:
The 12th I
- Page 216 and 217:
The 12th I
- Page 218 and 219:
The 12th I
- Page 220 and 221:
production and provide for marginal
- Page 222 and 223:
The 12th I
- Page 224 and 225:
The 12th I
- Page 226 and 227:
The 12th I
- Page 228 and 229:
The 12th I
- Page 230 and 231:
The 12th I
- Page 232 and 233:
The 12th I
- Page 234 and 235:
The 12th I
- Page 236 and 237:
The 12th I
- Page 238 and 239:
The 12th I
- Page 240 and 241:
The 12th I
- Page 242 and 243:
In addition, it can also be observe
- Page 244 and 245:
The 12th I
- Page 246 and 247:
owner is normally only interested i
- Page 248 and 249:
The 12th I
- Page 250 and 251:
The 12th I
- Page 252 and 253:
The 12th I
- Page 254 and 255:
The 12th I
- Page 256 and 257: The 12th I
- Page 258 and 259: The 12th I
- Page 260 and 261: The 12th I
- Page 262 and 263: The 12th I
- Page 264 and 265: The 12th I
- Page 266 and 267: The 12th I
- Page 268 and 269: The 12th I
- Page 270 and 271: The 12th I
- Page 272 and 273: The 12th I
- Page 274 and 275: The 12th I
- Page 276 and 277: The 12th I
- Page 278 and 279: The 12th I
- Page 280 and 281: The 12th I
- Page 282 and 283: The 12th I
- Page 284 and 285: The 12th I
- Page 286 and 287: The 12th I
- Page 288 and 289: The 12th I
- Page 290 and 291: Stockholm district heating system a
- Page 292 and 293: The 12th I
- Page 294 and 295: The 12th I
- Page 296 and 297: The 12th I
- Page 298 and 299: The 12th I
- Page 300 and 301: The 12th I
- Page 302 and 303: The 12th I
- Page 304 and 305: The 12th I
- Page 308 and 309: The 12th I
- Page 310 and 311: The 12th I
- Page 312 and 313: The 12th I
- Page 314 and 315: The values presented do of course l
- Page 316 and 317: The 12th I
- Page 318 and 319: The 12th I
- Page 320 and 321: The 12th I
- Page 322 and 323: The 12th I
- Page 324 and 325: The 12th I
- Page 326: The 12th I