The <str<strong>on</strong>g>12th</str<strong>on</strong>g> <str<strong>on</strong>g>Internati<strong>on</strong>al</str<strong>on</strong>g> <str<strong>on</strong>g>Symposium</str<strong>on</strong>g> <strong>on</strong> <strong>District</strong> <strong>Heating</strong> <strong>and</strong> <strong>Cooling</strong>,September 5 th to September 7 th , 2010, Tallinn, Est<strong>on</strong>iaDAILY HEAT LOAD VARIATION IN SWEDISH DISTRICT HEATING SYSTEMSH. Gadd <strong>and</strong> S. WernerSchool of Business <strong>and</strong> Engineering, Halmstad UniversitySE-301 18 Halmstad, Ph<strong>on</strong>e: +46 35 167757henrik.gadd@hh.se, sven.werner@hh.se, www.hh.seABSTRACTIf daily heat load variati<strong>on</strong>s could be eliminated indistrict heating-systems, it would make the operati<strong>on</strong> ofthe district heating system less costly <strong>and</strong> morecompetitive . There would be several advantages in theoperati<strong>on</strong> such as:Less use of expensive peak load power whereoften expensive fuels are used.Less need for peak load power capacity.Easier to optimize the operati<strong>on</strong> that leads tohigher c<strong>on</strong>versi<strong>on</strong> efficiencies.Less need for maintenance because of moresmooth operati<strong>on</strong> of the plantsThere are a number of ways to h<strong>and</strong>le the dailyvariati<strong>on</strong>s of the heat load. Two often used are largeheat storages or using the district heating network astemporary storage. If it would be possible to centrallyc<strong>on</strong>trol the customer substati<strong>on</strong>s, it would also bepossible to use heavy buildings c<strong>on</strong>nected to thedistrict heating system as heat storages.To be able to find the best way to reduce or eveneliminate the daily heat load variati<strong>on</strong>s, you need tounderst<strong>and</strong> the characteristics of the daily variati<strong>on</strong>s.This paper will describe a way of characterizing dailyheat load variati<strong>on</strong>s in some Swedish district heatingsystems.INTRODUCTIONFor all heat generati<strong>on</strong>/distributi<strong>on</strong> systems, heat loadvariati<strong>on</strong>s leads to inefficiencies. You need to designyour system for the peak load even though you <strong>on</strong>lyneed the top capacity for a very short period of time ofthe year. This is of cause expensive. The soluti<strong>on</strong> tothis problem is heat storage. There are a number ofpossibilities to store heat in DH systems:Large heat storages at the heat generati<strong>on</strong> plantsHeat storage in district heating networksHeat storage in heavy buildings in by allowingsmall variati<strong>on</strong> in indoor temperatures[1].If it would be possible to extinguish daily variati<strong>on</strong>s itwould lead to several profitable advantages such as:Less use of expensive peak load power whereoften expensive fuels are used.Less need for peak load power capacity.Easier to optimize the operati<strong>on</strong> that leads tohigher c<strong>on</strong>versi<strong>on</strong> efficiencies.Less need for maintenance because of moresmooth operati<strong>on</strong> of the plantsTo do this some questi<strong>on</strong>s need to be answered:What input <strong>and</strong> output capacity to/from the heatstorage is needed?What size of the heat storage is needed?Are the daily heat variati<strong>on</strong>s in the specific systemlarge or small during a year?METHODNomenclatureP h = Present hour value [MWh/h]P d = Mean hour value for the present day [MWh/h]P a = Mean hour value for the whole year [MWh/h]S h = Energy transfer capacity [MWh/h]S d = Size of heat storage [MWh/day]S a = Total annual daily heat load variati<strong>on</strong>h= Momentary daily variati<strong>on</strong> [h/h]d= Total daily variati<strong>on</strong> [h/day]a= Total annual relative daily variati<strong>on</strong> [h/year]VariablesMeasured data has been collected from some districtheating systems in Sweden. The collected data is theheat power that is generated <strong>and</strong> fed into the districtheating network. It is hour mean power that is used, i.e.8 760 data points per year. Only whole years is usedfrom 1 of January to 31 of December. To describe thedaily variati<strong>on</strong> three variables is defined.1. Momentary daily variati<strong>on</strong> ( h)2. Total daily variati<strong>on</strong>. ( d)3. Total annual relative daily variati<strong>on</strong>. ( a)Three system examples are presented in this paper toexemplify the method to characterize district heatingdaily heat load variati<strong>on</strong>:System A: From a city in South of Sweden with anannual heat generati<strong>on</strong> of 200 GWh.199
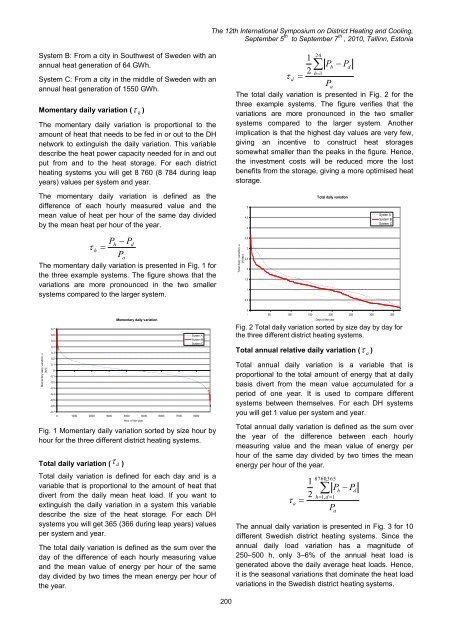
The <str<strong>on</strong>g>12th</str<strong>on</strong>g> <str<strong>on</strong>g>Internati<strong>on</strong>al</str<strong>on</strong>g> <str<strong>on</strong>g>Symposium</str<strong>on</strong>g> <strong>on</strong> <strong>District</strong> <strong>Heating</strong> <strong>and</strong> <strong>Cooling</strong>,September 5 th to September 7 th , 2010, Tallinn, Est<strong>on</strong>iaSystem B: From a city in Southwest of Sweden with anannual heat generati<strong>on</strong> of 64 GWh.System C: From a city in the middle of Sweden with anannual heat generati<strong>on</strong> of 1550 GWh.Momentary daily variati<strong>on</strong> ( )The momentary daily variati<strong>on</strong> is proporti<strong>on</strong>al to theamount of heat that needs to be fed in or out to the DHnetwork to extinguish the daily variati<strong>on</strong>. This variabledescribe the heat power capacity needed for in <strong>and</strong> output from <strong>and</strong> to the heat storage. For each districtheating systems you will get 8 760 (8 784 during leapyears) values per system <strong>and</strong> year.hd1224h1P PThe total daily variati<strong>on</strong> is presented in Fig. 2 for thethree example systems. The figure verifies that thevariati<strong>on</strong>s are more pr<strong>on</strong>ounced in the two smallersystems compared to the larger system. Anotherimplicati<strong>on</strong> is that the highest day values are very few,giving an incentive to c<strong>on</strong>struct heat storagessomewhat smaller than the peaks in the figure. Hence,the investment costs will be reduced more the lostbenefits from the storage, giving a more optimised heatstorage.PhadThe momentary daily variati<strong>on</strong> is defined as thedifference of each hourly measured value <strong>and</strong> themean value of heat per hour of the same day dividedby the mean heat per hour of the year.54,54Total daily variati<strong>on</strong>Systen ASystem BSystem CPh PdhPaThe momentary daily variati<strong>on</strong> is presented in Fig. 1 forthe three example systems. The figure shows that thevariati<strong>on</strong>s are more pr<strong>on</strong>ounced in the two smallersystems compared to the larger system.Total daily variati<strong>on</strong>, τd[h/day]3,532,521,510,5Momentary daily variati<strong>on</strong>, τh[h/h]0,70,60,50,40,30,20,10-0,1-0,2-0,3-0,4-0,5-0,6-0,7Momentary daily variati<strong>on</strong>0 1000 2000 3000 4000 5000 6000 7000 8000Hour of the yearSysten ASystem BSystem CFig. 1 Momentary daily variati<strong>on</strong> sorted by size hour byhour for the three different district heating systems.Total daily variati<strong>on</strong> ( d )Total daily variati<strong>on</strong> is defined for each day <strong>and</strong> is avariable that is proporti<strong>on</strong>al to the amount of heat thatdivert from the daily mean heat load. If you want toextinguish the daily variati<strong>on</strong> in a system this variabledescribe the size of the heat storage. For each DHsystems you will get 365 (366 during leap years) valuesper system <strong>and</strong> year.The total daily variati<strong>on</strong> is defined as the sum over theday of the difference of each hourly measuring value<strong>and</strong> the mean value of energy per hour of the sameday divided by two times the mean energy per hour ofthe year.0- 50 100 150 200 250 300 350Days of the yearFig. 2 Total daily variati<strong>on</strong> sorted by size day by day forthe three different district heating systems.Total annual relative daily variati<strong>on</strong> ( )Total annual daily variati<strong>on</strong> is a variable that isproporti<strong>on</strong>al to the total amount of energy that at dailybasis divert from the mean value accumulated for aperiod of <strong>on</strong>e year. It is used to compare differentsystems between themselves. For each DH systemsyou will get 1 value per system <strong>and</strong> year.Total annual daily variati<strong>on</strong> is defined as the sum overthe year of the difference between each hourlymeasuring value <strong>and</strong> the mean value of energy perhour of the same day divided by two times the meanenergy per hour of the year. a128760,365hh1,d 1PP PThe annual daily variati<strong>on</strong> is presented in Fig. 3 for 10different Swedish district heating systems. Since theannual daily load variati<strong>on</strong> has a magnitude of250–500 h, <strong>on</strong>ly 3–6% of the annual heat load isgenerated above the daily average heat loads. Hence,it is the seas<strong>on</strong>al variati<strong>on</strong>s that dominate the heat loadvariati<strong>on</strong>s in the Swedish district heating systems.ada200
- Page 1:
12th Inter
- Page 5 and 6:
The 12th I
- Page 7 and 8:
The 12th I
- Page 10 and 11:
The 12th I
- Page 12 and 13:
The 12th I
- Page 14 and 15:
For the case of parallel buried pip
- Page 16 and 17:
The 12th I
- Page 18 and 19:
The 12th I
- Page 20 and 21:
The 12th I
- Page 22 and 23:
The 12th I
- Page 24 and 25:
The 12th I
- Page 26 and 27:
The 12th I
- Page 28 and 29:
The 12th I
- Page 30 and 31:
The 12th I
- Page 32 and 33:
The 12th I
- Page 34 and 35:
The 12th I
- Page 36 and 37:
The 12th I
- Page 38 and 39:
The 12th I
- Page 40 and 41:
The 12th I
- Page 42 and 43:
The 12th I
- Page 44 and 45:
The 12th I
- Page 46 and 47:
The 12th I
- Page 48 and 49:
The 12th I
- Page 50 and 51:
The 12th I
- Page 52 and 53:
The 12th I
- Page 54 and 55:
The 12th I
- Page 56 and 57:
The 12th I
- Page 58 and 59:
The 12th I
- Page 60 and 61:
The 12th I
- Page 62 and 63:
The 12th I
- Page 64 and 65:
The 12th I
- Page 66 and 67:
The 12th I
- Page 68 and 69:
The 12th I
- Page 70 and 71:
The 12th I
- Page 72 and 73:
The 12th I
- Page 74 and 75:
The 12th I
- Page 76 and 77:
The 12th I
- Page 78 and 79:
The 12th I
- Page 80 and 81:
The 12th I
- Page 82 and 83:
The 12th I
- Page 84 and 85:
The 12th I
- Page 86 and 87:
The 12th I
- Page 88 and 89:
The 12th I
- Page 90 and 91:
The 12th I
- Page 92 and 93:
The 12th I
- Page 94 and 95:
The 12th I
- Page 96 and 97:
The 12th I
- Page 98 and 99:
the street the more shallow the sha
- Page 100 and 101:
The 12th I
- Page 102 and 103:
The 12th I
- Page 104 and 105:
The 12th I
- Page 106 and 107:
The 12th I
- Page 108 and 109:
The 12th I
- Page 110 and 111:
P-1P-4P-9P-7E-5P-14P-8The 1
- Page 112 and 113:
The 12th I
- Page 114 and 115:
The 12th I
- Page 116 and 117:
The 12th I
- Page 118 and 119:
The 12th I
- Page 120 and 121:
The 12th I
- Page 122 and 123:
The 12th I
- Page 124 and 125:
The 12th I
- Page 126 and 127:
The 12th I
- Page 128 and 129:
The 12th I
- Page 130 and 131:
The 12th I
- Page 132 and 133:
The 12th I
- Page 134 and 135:
The 12th I
- Page 136 and 137:
The 12th I
- Page 138 and 139:
to heating costs of 14,5 ct/kWh. Th
- Page 140 and 141:
The 12th I
- Page 142 and 143:
The 12th I
- Page 144 and 145:
The 12th I
- Page 146 and 147:
The 12th I
- Page 148 and 149:
academic access is facilitated as t
- Page 150 and 151: The 12th I
- Page 152 and 153: The 12th I
- Page 154 and 155: The 12th I
- Page 156 and 157: The 12th I
- Page 158 and 159: The 12th I
- Page 160 and 161: The 12th I
- Page 162 and 163: 1. CHP system operation in A2. Ther
- Page 164 and 165: The 12th I
- Page 166 and 167: is covered by operating HOB. In oth
- Page 168 and 169: The 12th I
- Page 170 and 171: The 12th I
- Page 172 and 173: The 12th I
- Page 174 and 175: The 12th I
- Page 176 and 177: The 12th I
- Page 178 and 179: The 12th I
- Page 180 and 181: The 12th I
- Page 182 and 183: The 12th I
- Page 184 and 185: The 12th I
- Page 186 and 187: The 12th I
- Page 188 and 189: The 12th I
- Page 190 and 191: The 12th I
- Page 192 and 193: The 12th I
- Page 194 and 195: The 12th I
- Page 196 and 197: produce heat and electricity. Fluct
- Page 198 and 199: The 12th I
- Page 202 and 203: The 12th I
- Page 204 and 205: The 12th I
- Page 206 and 207: The 12th I
- Page 208 and 209: The 12th I
- Page 210 and 211: To assure that the temperatures mea
- Page 212 and 213: The 12th I
- Page 214 and 215: The 12th I
- Page 216 and 217: The 12th I
- Page 218 and 219: The 12th I
- Page 220 and 221: production and provide for marginal
- Page 222 and 223: The 12th I
- Page 224 and 225: The 12th I
- Page 226 and 227: The 12th I
- Page 228 and 229: The 12th I
- Page 230 and 231: The 12th I
- Page 232 and 233: The 12th I
- Page 234 and 235: The 12th I
- Page 236 and 237: The 12th I
- Page 238 and 239: The 12th I
- Page 240 and 241: The 12th I
- Page 242 and 243: In addition, it can also be observe
- Page 244 and 245: The 12th I
- Page 246 and 247: owner is normally only interested i
- Page 248 and 249: The 12th I
- Page 250 and 251:
The 12th I
- Page 252 and 253:
The 12th I
- Page 254 and 255:
The 12th I
- Page 256 and 257:
The 12th I
- Page 258 and 259:
The 12th I
- Page 260 and 261:
The 12th I
- Page 262 and 263:
The 12th I
- Page 264 and 265:
The 12th I
- Page 266 and 267:
The 12th I
- Page 268 and 269:
The 12th I
- Page 270 and 271:
The 12th I
- Page 272 and 273:
The 12th I
- Page 274 and 275:
The 12th I
- Page 276 and 277:
The 12th I
- Page 278 and 279:
The 12th I
- Page 280 and 281:
The 12th I
- Page 282 and 283:
The 12th I
- Page 284 and 285:
The 12th I
- Page 286 and 287:
The 12th I
- Page 288 and 289:
The 12th I
- Page 290 and 291:
Stockholm district heating system a
- Page 292 and 293:
The 12th I
- Page 294 and 295:
The 12th I
- Page 296 and 297:
The 12th I
- Page 298 and 299:
The 12th I
- Page 300 and 301:
The 12th I
- Page 302 and 303:
The 12th I
- Page 304 and 305:
The 12th I
- Page 306 and 307:
The 12th I
- Page 308 and 309:
The 12th I
- Page 310 and 311:
The 12th I
- Page 312 and 313:
The 12th I
- Page 314 and 315:
The values presented do of course l
- Page 316 and 317:
The 12th I
- Page 318 and 319:
The 12th I
- Page 320 and 321:
The 12th I
- Page 322 and 323:
The 12th I
- Page 324 and 325:
The 12th I
- Page 326:
The 12th I