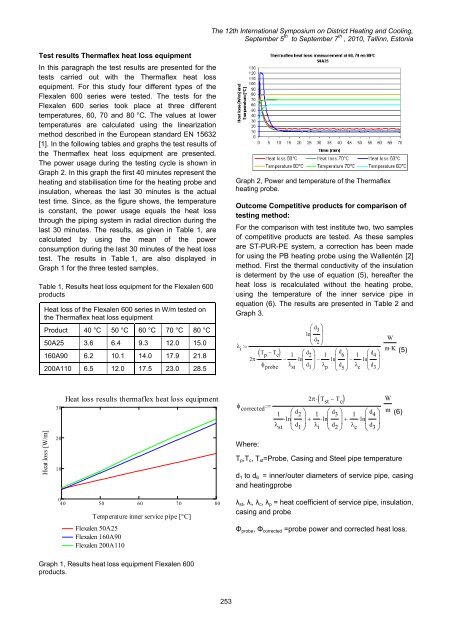
The <str<strong>on</strong>g>12th</str<strong>on</strong>g> <str<strong>on</strong>g>Internati<strong>on</strong>al</str<strong>on</strong>g> <str<strong>on</strong>g>Symposium</str<strong>on</strong>g> <strong>on</strong> <strong>District</strong> <strong>Heating</strong> <strong>and</strong> <strong>Cooling</strong>,September 5 th to September 7 th , 2010, Tallinn, Est<strong>on</strong>iaTest results Thermaflex heat loss equipmentIn this paragraph the test results are presented for thetests carried out with the Thermaflex heat lossequipment. For this study four different types of theFlexalen 600 series were tested. The tests for theFlexalen 600 series took place at three differenttemperatures, 60, 70 <strong>and</strong> 80 °C. The values at lowertemperatures are calculated using the linearizati<strong>on</strong>method described in the European st<strong>and</strong>ard EN 15632[1]. In the following tables <strong>and</strong> graphs the test results ofthe Thermaflex heat loss equipment are presented.The power usage during the testing cycle is shown inGraph 2. In this graph the first 40 minutes represent theheating <strong>and</strong> stabilisati<strong>on</strong> time for the heating probe <strong>and</strong>insulati<strong>on</strong>, whereas the last 30 minutes is the actualtest time. Since, as the figure shows, the temperatureis c<strong>on</strong>stant, the power usage equals the heat lossthrough the piping system in radial directi<strong>on</strong> during thelast 30 minutes. The results, as given in Table 1, arecalculated by using the mean of the powerc<strong>on</strong>sumpti<strong>on</strong> during the last 30 minutes of the heat losstest. The results in Table 1, are also displayed inGraph 1 for the three tested samples.Table 1, Results heat loss equipment for the Flexalen 600productsHeat loss of the Flexalen 600 series in W/m tested <strong>on</strong>the Thermaflex heat loss equipmentProduct 40 °C 50 °C 60 °C 70 °C 80 °C50A25 3.6 6.4 9.3 12.0 15.0160A90 6.2 10.1 14.0 17.9 21.8200A110 6.5 12.0 17.5 23.0 28.5Graph 2, Power <strong>and</strong> temperature of the Thermaflexheating probe.Outcome Competitive products for comparis<strong>on</strong> oftesting method:For the comparis<strong>on</strong> with test institute two, two samplesof competitive products are tested. As these samplesare ST-PUR-PE system, a correcti<strong>on</strong> has been madefor using the PB heating probe using the Wallentén [2]method. First the thermal c<strong>on</strong>ductivity of the insulati<strong>on</strong>is determent by the use of equati<strong>on</strong> (5), hereafter theheat loss is recalculated without the heating probe,using the temperature of the inner service pipe inequati<strong>on</strong> (6). The results are presented in Table 2 <strong>and</strong>Graph 3. iT p T c2 probe d 3ln d 2 1 dln2 1 d 6 ln 1 d ln4 st d 1 p d 5 c d 3 Wm K (5)Heat loss [W/m]302010Heat loss results thermaflex heat loss equipment 2 T st T c corrected1 d 2ln 1 dln3 1 d 4 ln st d 1 i d 2 c d 3Where: Wm (6)T p ,T c , T st =Probe, Casing <strong>and</strong> Steel pipe temperatured 1 to d 6 = inner/outer diameters of service pipe, casing<strong>and</strong> heatingprobe040 50 60 70 80Temp erature inner service pipe [°C]Flexalen 50A25Flexalen 160A90Flexalen 200A110λ st , λ i , λ c , λ p = heat coefficient of service pipe, insulati<strong>on</strong>,casing <strong>and</strong> probeΦ probe , Φ corrected =probe power <strong>and</strong> corrected heat loss.Graph 1, Results heat loss equipment Flexalen 600products.253
The <str<strong>on</strong>g>12th</str<strong>on</strong>g> <str<strong>on</strong>g>Internati<strong>on</strong>al</str<strong>on</strong>g> <str<strong>on</strong>g>Symposium</str<strong>on</strong>g> <strong>on</strong> <strong>District</strong> <strong>Heating</strong> <strong>and</strong> <strong>Cooling</strong>,September 5 th to September 7 th , 2010, Tallinn, Est<strong>on</strong>iaTable 2, Results heat loss equipment for the competitiveproductsHeat loss of competitive products in W/m tested <strong>on</strong>the Thermaflex heat loss equipmentSample 40 °C 50 °C 60 °C 70 °C 80 °CSample 1 2.5 4.5 6.4 8.4 10.3Sample 2 6.5 8.8 11.2 13.5 15.9made of metal. Furthermore no heat guards are used.This means the outer ends of the piping system areinsulated <strong>and</strong> the heat loss is corrected with acalculated value. In the paragraph ―European st<strong>and</strong>ardmethod descripti<strong>on</strong>‖ a more detailed descripti<strong>on</strong> isgiven. As can be seen in Fig 4 the heat distributi<strong>on</strong> inthis case is not uniform al<strong>on</strong>g the test specimen,proving the need for the van Rinsum correcti<strong>on</strong>.Sample 320Heat loss results thermaflex heat loss equipmentHeat loss [W/m]15105040 50 60 70 80Temp erature inner service pipe [°C]Competitive samp le 1Competitive samp le 2Fig 4, Thermal image of the sample at institute <strong>on</strong>eIn c<strong>on</strong>tradicti<strong>on</strong> to the Thermaflex test rig, no integratedcomputer c<strong>on</strong>trolled power supply system is used. Thepower for the heating probe is first theoreticallycalculated <strong>and</strong> manually set to this value. For thetemperature measurement thermocouples <strong>and</strong> a datalogger with computer link are used.Graph 3, Results heat loss equipment for the competitiveproductsTEST INSTITUTE ONEThis institute is specialized in measuring heat loss indifferent types of insulati<strong>on</strong>. The test facility used forthe Flexalen 600 system is specially designed formeasuring the heat loss of (pre-) insulated pipingsystems. This means the facility is designed tomeasure all different types <strong>and</strong> diameters.Measurement principle institute <strong>on</strong>eThe measurements are all based <strong>on</strong> the calculated endapparatus, using the van Rinsum theory as correcti<strong>on</strong>,as described in the paragraph European st<strong>and</strong>ard [1]method descripti<strong>on</strong> of this paper.Physical test facilityThe physical part of the test facility is similar to theThermaflex test rig <strong>and</strong> also c<strong>on</strong>sists out of the threeelements: A temperature c<strong>on</strong>trolled compartmentwhere the tests are carried out at a c<strong>on</strong>stanttemperature of 23 °C. FIW also uses heating probes asa heat source but, since it is not specially designed forthe Flexalen 600 system, they are made to fit allsystems. To ensure the fit of the probes in all differentsystems the diameters are smaller, <strong>and</strong> for durability254Method of testingThe heating probe is positi<strong>on</strong>ed in the centre of the testpipe with positi<strong>on</strong>ing foam in three secti<strong>on</strong>s of the pipe.On these foam blocks four thermocouples are placed in0, 90, 180 <strong>and</strong> 270 degrees <strong>on</strong> the inner surface of theservice pipe. For the outcome of the pipe innertemperature the mean of the four values is used. Tomeasure the temperature <strong>on</strong> the outside casing of theinsulati<strong>on</strong>, five groups of four thermocouples are usedin the same c<strong>on</strong>figurati<strong>on</strong> as the inner pipe. Thedifference being that the thermocouples are placedboth <strong>on</strong> <strong>and</strong> in between the corrugati<strong>on</strong>s of the casing.The test sample, with the heating probe, is placed inthe c<strong>on</strong>diti<strong>on</strong>ed c<strong>on</strong>tainer thereafter the test can bestarted. The power supply of the heater is turned <strong>on</strong> bysetting the voltage <strong>and</strong> current of the power unit to afixed value so the electrical power equals thecalculated heat loss.Depending <strong>on</strong> the diameter of the test sample <strong>and</strong> thetest temperature the waiting time for the heating of thesample is five to eight hours due to the low, fixed powerinput. After a c<strong>on</strong>stant temperature of the outer casingis achieved the actual test cycles start. Each test cyclec<strong>on</strong>sists of a measurement of 30 min in which the outercasing temperature is to be c<strong>on</strong>stant. If not the cyclehas to be restarted. In total ten cycles will be performed<strong>on</strong> each sample. After the test the values are corrected
- Page 1:
12th Inter
- Page 5 and 6:
The 12th I
- Page 7 and 8:
The 12th I
- Page 10 and 11:
The 12th I
- Page 12 and 13:
The 12th I
- Page 14 and 15:
For the case of parallel buried pip
- Page 16 and 17:
The 12th I
- Page 18 and 19:
The 12th I
- Page 20 and 21:
The 12th I
- Page 22 and 23:
The 12th I
- Page 24 and 25:
The 12th I
- Page 26 and 27:
The 12th I
- Page 28 and 29:
The 12th I
- Page 30 and 31:
The 12th I
- Page 32 and 33:
The 12th I
- Page 34 and 35:
The 12th I
- Page 36 and 37:
The 12th I
- Page 38 and 39:
The 12th I
- Page 40 and 41:
The 12th I
- Page 42 and 43:
The 12th I
- Page 44 and 45:
The 12th I
- Page 46 and 47:
The 12th I
- Page 48 and 49:
The 12th I
- Page 50 and 51:
The 12th I
- Page 52 and 53:
The 12th I
- Page 54 and 55:
The 12th I
- Page 56 and 57:
The 12th I
- Page 58 and 59:
The 12th I
- Page 60 and 61:
The 12th I
- Page 62 and 63:
The 12th I
- Page 64 and 65:
The 12th I
- Page 66 and 67:
The 12th I
- Page 68 and 69:
The 12th I
- Page 70 and 71:
The 12th I
- Page 72 and 73:
The 12th I
- Page 74 and 75:
The 12th I
- Page 76 and 77:
The 12th I
- Page 78 and 79:
The 12th I
- Page 80 and 81:
The 12th I
- Page 82 and 83:
The 12th I
- Page 84 and 85:
The 12th I
- Page 86 and 87:
The 12th I
- Page 88 and 89:
The 12th I
- Page 90 and 91:
The 12th I
- Page 92 and 93:
The 12th I
- Page 94 and 95:
The 12th I
- Page 96 and 97:
The 12th I
- Page 98 and 99:
the street the more shallow the sha
- Page 100 and 101:
The 12th I
- Page 102 and 103:
The 12th I
- Page 104 and 105:
The 12th I
- Page 106 and 107:
The 12th I
- Page 108 and 109:
The 12th I
- Page 110 and 111:
P-1P-4P-9P-7E-5P-14P-8The 1
- Page 112 and 113:
The 12th I
- Page 114 and 115:
The 12th I
- Page 116 and 117:
The 12th I
- Page 118 and 119:
The 12th I
- Page 120 and 121:
The 12th I
- Page 122 and 123:
The 12th I
- Page 124 and 125:
The 12th I
- Page 126 and 127:
The 12th I
- Page 128 and 129:
The 12th I
- Page 130 and 131:
The 12th I
- Page 132 and 133:
The 12th I
- Page 134 and 135:
The 12th I
- Page 136 and 137:
The 12th I
- Page 138 and 139:
to heating costs of 14,5 ct/kWh. Th
- Page 140 and 141:
The 12th I
- Page 142 and 143:
The 12th I
- Page 144 and 145:
The 12th I
- Page 146 and 147:
The 12th I
- Page 148 and 149:
academic access is facilitated as t
- Page 150 and 151:
The 12th I
- Page 152 and 153:
The 12th I
- Page 154 and 155:
The 12th I
- Page 156 and 157:
The 12th I
- Page 158 and 159:
The 12th I
- Page 160 and 161:
The 12th I
- Page 162 and 163:
1. CHP system operation in A2. Ther
- Page 164 and 165:
The 12th I
- Page 166 and 167:
is covered by operating HOB. In oth
- Page 168 and 169:
The 12th I
- Page 170 and 171:
The 12th I
- Page 172 and 173:
The 12th I
- Page 174 and 175:
The 12th I
- Page 176 and 177:
The 12th I
- Page 178 and 179:
The 12th I
- Page 180 and 181:
The 12th I
- Page 182 and 183:
The 12th I
- Page 184 and 185:
The 12th I
- Page 186 and 187:
The 12th I
- Page 188 and 189:
The 12th I
- Page 190 and 191:
The 12th I
- Page 192 and 193:
The 12th I
- Page 194 and 195:
The 12th I
- Page 196 and 197:
produce heat and electricity. Fluct
- Page 198 and 199:
The 12th I
- Page 200 and 201:
The 12th I
- Page 202 and 203:
The 12th I
- Page 204 and 205: The 12th I
- Page 206 and 207: The 12th I
- Page 208 and 209: The 12th I
- Page 210 and 211: To assure that the temperatures mea
- Page 212 and 213: The 12th I
- Page 214 and 215: The 12th I
- Page 216 and 217: The 12th I
- Page 218 and 219: The 12th I
- Page 220 and 221: production and provide for marginal
- Page 222 and 223: The 12th I
- Page 224 and 225: The 12th I
- Page 226 and 227: The 12th I
- Page 228 and 229: The 12th I
- Page 230 and 231: The 12th I
- Page 232 and 233: The 12th I
- Page 234 and 235: The 12th I
- Page 236 and 237: The 12th I
- Page 238 and 239: The 12th I
- Page 240 and 241: The 12th I
- Page 242 and 243: In addition, it can also be observe
- Page 244 and 245: The 12th I
- Page 246 and 247: owner is normally only interested i
- Page 248 and 249: The 12th I
- Page 250 and 251: The 12th I
- Page 252 and 253: The 12th I
- Page 256 and 257: The 12th I
- Page 258 and 259: The 12th I
- Page 260 and 261: The 12th I
- Page 262 and 263: The 12th I
- Page 264 and 265: The 12th I
- Page 266 and 267: The 12th I
- Page 268 and 269: The 12th I
- Page 270 and 271: The 12th I
- Page 272 and 273: The 12th I
- Page 274 and 275: The 12th I
- Page 276 and 277: The 12th I
- Page 278 and 279: The 12th I
- Page 280 and 281: The 12th I
- Page 282 and 283: The 12th I
- Page 284 and 285: The 12th I
- Page 286 and 287: The 12th I
- Page 288 and 289: The 12th I
- Page 290 and 291: Stockholm district heating system a
- Page 292 and 293: The 12th I
- Page 294 and 295: The 12th I
- Page 296 and 297: The 12th I
- Page 298 and 299: The 12th I
- Page 300 and 301: The 12th I
- Page 302 and 303: The 12th I
- Page 304 and 305:
The 12th I
- Page 306 and 307:
The 12th I
- Page 308 and 309:
The 12th I
- Page 310 and 311:
The 12th I
- Page 312 and 313:
The 12th I
- Page 314 and 315:
The values presented do of course l
- Page 316 and 317:
The 12th I
- Page 318 and 319:
The 12th I
- Page 320 and 321:
The 12th I
- Page 322 and 323:
The 12th I
- Page 324 and 325:
The 12th I
- Page 326:
The 12th I