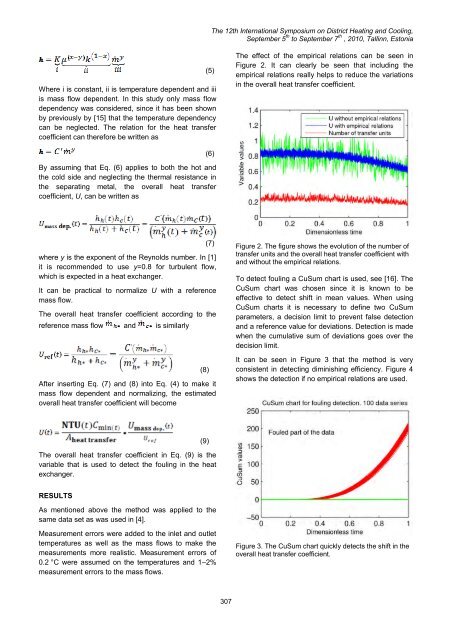
The <str<strong>on</strong>g>12th</str<strong>on</strong>g> <str<strong>on</strong>g>Internati<strong>on</strong>al</str<strong>on</strong>g> <str<strong>on</strong>g>Symposium</str<strong>on</strong>g> <strong>on</strong> <strong>District</strong> <strong>Heating</strong> <strong>and</strong> <strong>Cooling</strong>,September 5 th to September 7 th , 2010, Tallinn, Est<strong>on</strong>iaWhere i is c<strong>on</strong>stant, ii is temperature dependent <strong>and</strong> iiiis mass flow dependent. In this study <strong>on</strong>ly mass flowdependency was c<strong>on</strong>sidered, since it has been shownby previously by [15] that the temperature dependencycan be neglected. The relati<strong>on</strong> for the heat transfercoefficient can therefore be written as(5)The effect of the empirical relati<strong>on</strong>s can be seen inFigure 2. It can clearly be seen that including theempirical relati<strong>on</strong>s really helps to reduce the variati<strong>on</strong>sin the overall heat transfer coefficient.By assuming that Eq. (6) applies to both the hot <strong>and</strong>the cold side <strong>and</strong> neglecting the thermal resistance inthe separating metal, the overall heat transfercoefficient, U, can be written as(6)where y is the exp<strong>on</strong>ent of the Reynolds number. In [1]it is recommended to use y=0.8 for turbulent flow,which is expected in a heat exchanger.It can be practical to normalize U with a referencemass flow.The overall heat transfer coefficient according to thereference mass flow <strong>and</strong> is similarlyAfter inserting Eq. (7) <strong>and</strong> (8) into Eq. (4) to make itmass flow dependent <strong>and</strong> normalizing, the estimatedoverall heat transfer coefficient will become(8)(7)Figure 2. The figure shows the evoluti<strong>on</strong> of the number oftransfer units <strong>and</strong> the overall heat transfer coefficient with<strong>and</strong> without the empirical relati<strong>on</strong>s.To detect fouling a CuSum chart is used, see [16]. TheCuSum chart was chosen since it is known to beeffective to detect shift in mean values. When usingCuSum charts it is necessary to define two CuSumparameters, a decisi<strong>on</strong> limit to prevent false detecti<strong>on</strong><strong>and</strong> a reference value for deviati<strong>on</strong>s. Detecti<strong>on</strong> is madewhen the cumulative sum of deviati<strong>on</strong>s goes over thedecisi<strong>on</strong> limit.It can be seen in Figure 3 that the method is veryc<strong>on</strong>sistent in detecting diminishing efficiency. Figure 4shows the detecti<strong>on</strong> if no empirical relati<strong>on</strong>s are used.The overall heat transfer coefficient in Eq. (9) is thevariable that is used to detect the fouling in the heatexchanger.(9)RESULTSAs menti<strong>on</strong>ed above the method was applied to thesame data set as was used in [4].Measurement errors were added to the inlet <strong>and</strong> outlettemperatures as well as the mass flows to make themeasurements more realistic. Measurement errors of0.2 °C were assumed <strong>on</strong> the temperatures <strong>and</strong> 1–2%measurement errors to the mass flows.Figure 3. The CuSum chart quickly detects the shift in theoverall heat transfer coefficient.307
The <str<strong>on</strong>g>12th</str<strong>on</strong>g> <str<strong>on</strong>g>Internati<strong>on</strong>al</str<strong>on</strong>g> <str<strong>on</strong>g>Symposium</str<strong>on</strong>g> <strong>on</strong> <strong>District</strong> <strong>Heating</strong> <strong>and</strong> <strong>Cooling</strong>,September 5 th to September 7 th , 2010, Tallinn, Est<strong>on</strong>iamethod seems also to be very stable in detecting thefouling.DISCUSSION AND CONCLUSIONThe results indicate that the method proposed can beused to detect fouling in cross flow heat exchangersoperating under dynamic c<strong>on</strong>diti<strong>on</strong> by usingmeasurements that can be obtained under normaloperati<strong>on</strong>. The detecti<strong>on</strong> method is based <strong>on</strong> the wellknown method of Number of Transfer Units, withadditi<strong>on</strong> of empirical relati<strong>on</strong>s to make the method validover wide range of mass flow rates.Figure 4. The CuSum chart quickly detects the shift in theoverall heat transfer coefficient.Comparis<strong>on</strong> of Figures 3 <strong>and</strong> 4 shows that it is possibleto detect fouling in heat exchangers operating indynamic c<strong>on</strong>diti<strong>on</strong> with quite good accuracy by usingthe NTU method <strong>and</strong> empirical relati<strong>on</strong>s.In Table 1 a comparis<strong>on</strong> between the method in [4] <strong>and</strong>the method presented in this paper is shown. From thetable it is apparent that the method presented in thispaper gives better results. The fouling detecti<strong>on</strong> intervalfor the drift corresp<strong>on</strong>ds to fouling factors <strong>on</strong> theintervals [0.00002, 0.00004] <strong>and</strong> [0.00001, 0.00003]respectively for the fast <strong>and</strong> slow fouling. The methodis therefore giving c<strong>on</strong>siderable better results than themethod described in [4].Table 1: Comparis<strong>on</strong> of detecti<strong>on</strong> time between the twomethods, where method 1 is from [4]PercentilesMethod 1 Method 2Fast2.5% 0.59 0.2650% 0.83 0.3597.5% 0.98 0.40PercentilesSlow2.5% 0.63 0.2350% 0.81 0.3097.5% 0.93 0.35Typical fouling factors are, as stated above, <strong>on</strong> theinterval [0.0001, 0.0007]. The results therefore indicatethat the method can be used to detect fouling in crossflow heat exchangers that are operating in n<strong>on</strong>-steadystate c<strong>on</strong>diti<strong>on</strong> prior to the time a typical fouling factorheat exchangers are designed for is reached. TheBy m<strong>on</strong>itoring the calculated overall heat transfercoefficient, it is possible to detect changes that are dueto fouling or changes in the working fluid. Unlikec<strong>on</strong>venti<strong>on</strong>al methods, this method can detect foulingin heat exchangers that are not operated in steadystate c<strong>on</strong>diti<strong>on</strong>s. The fouling detecti<strong>on</strong> is performedwithin the designed fouling factor interval.Further work will include applicati<strong>on</strong> of the method <strong>on</strong>data from a real heat exchanger.ACKNOWLEDGEMENTThis work has been supported by the Envir<strong>on</strong>mental<strong>and</strong> Energy Research Fund of Orkuveita Reykjavíkur,Nati<strong>on</strong>al Energy Fund <strong>and</strong> Energy Research Fund ofL<strong>and</strong>svirkjun.REFERENCES[1] J. P. Holman Heat Transfer. Ninth editi<strong>on</strong>, McGrawHill, 2002.[2] M. Mishra, P. K. Das <strong>and</strong> S. Sarangi. "Effect oftemperature <strong>and</strong> flow n<strong>on</strong>-uniformity <strong>on</strong> transientbehaviour of crossflow heat exchanger".<str<strong>on</strong>g>Internati<strong>on</strong>al</str<strong>on</strong>g> Journal of Heat <strong>and</strong> Mass Transfer,2008, p. 2583-2592.[3] H. Kou <strong>and</strong> P. Yuan. "Thermal performance ofcrossflow heat exchanger with n<strong>on</strong>uniform inlettemperatures". <str<strong>on</strong>g>Internati<strong>on</strong>al</str<strong>on</strong>g> Communicati<strong>on</strong>s inHeat <strong>and</strong> Mass Transfer, 1997; 51(9-10):357-370.[4] O. Gudmundss<strong>on</strong>, H. Palss<strong>on</strong> <strong>and</strong> O. P. Palss<strong>on</strong>."Simulati<strong>on</strong> of fouling in cross-flow heat exchanger<strong>and</strong> a fouling detecti<strong>on</strong> based <strong>on</strong> physicalmodeling". In: Proceeding of The 50th C<strong>on</strong>ference<strong>on</strong> Simulati<strong>on</strong> <strong>and</strong> Modelling, Fredericia, Denmark,7-8th of October, 2009.[5] W. L. Pope, H. S. Pines, R. L. Fult<strong>on</strong> <strong>and</strong> P. A.Doyle. "Heat exchanger design "why guess afouling factor when it can be optimized?". EnergyTechnology C<strong>on</strong>ference <strong>and</strong> Exhibiti<strong>on</strong>. Hust<strong>on</strong>,Texas, 1978.308
- Page 1:
12th Inter
- Page 5 and 6:
The 12th I
- Page 7 and 8:
The 12th I
- Page 10 and 11:
The 12th I
- Page 12 and 13:
The 12th I
- Page 14 and 15:
For the case of parallel buried pip
- Page 16 and 17:
The 12th I
- Page 18 and 19:
The 12th I
- Page 20 and 21:
The 12th I
- Page 22 and 23:
The 12th I
- Page 24 and 25:
The 12th I
- Page 26 and 27:
The 12th I
- Page 28 and 29:
The 12th I
- Page 30 and 31:
The 12th I
- Page 32 and 33:
The 12th I
- Page 34 and 35:
The 12th I
- Page 36 and 37:
The 12th I
- Page 38 and 39:
The 12th I
- Page 40 and 41:
The 12th I
- Page 42 and 43:
The 12th I
- Page 44 and 45:
The 12th I
- Page 46 and 47:
The 12th I
- Page 48 and 49:
The 12th I
- Page 50 and 51:
The 12th I
- Page 52 and 53:
The 12th I
- Page 54 and 55:
The 12th I
- Page 56 and 57:
The 12th I
- Page 58 and 59:
The 12th I
- Page 60 and 61:
The 12th I
- Page 62 and 63:
The 12th I
- Page 64 and 65:
The 12th I
- Page 66 and 67:
The 12th I
- Page 68 and 69:
The 12th I
- Page 70 and 71:
The 12th I
- Page 72 and 73:
The 12th I
- Page 74 and 75:
The 12th I
- Page 76 and 77:
The 12th I
- Page 78 and 79:
The 12th I
- Page 80 and 81:
The 12th I
- Page 82 and 83:
The 12th I
- Page 84 and 85:
The 12th I
- Page 86 and 87:
The 12th I
- Page 88 and 89:
The 12th I
- Page 90 and 91:
The 12th I
- Page 92 and 93:
The 12th I
- Page 94 and 95:
The 12th I
- Page 96 and 97:
The 12th I
- Page 98 and 99:
the street the more shallow the sha
- Page 100 and 101:
The 12th I
- Page 102 and 103:
The 12th I
- Page 104 and 105:
The 12th I
- Page 106 and 107:
The 12th I
- Page 108 and 109:
The 12th I
- Page 110 and 111:
P-1P-4P-9P-7E-5P-14P-8The 1
- Page 112 and 113:
The 12th I
- Page 114 and 115:
The 12th I
- Page 116 and 117:
The 12th I
- Page 118 and 119:
The 12th I
- Page 120 and 121:
The 12th I
- Page 122 and 123:
The 12th I
- Page 124 and 125:
The 12th I
- Page 126 and 127:
The 12th I
- Page 128 and 129:
The 12th I
- Page 130 and 131:
The 12th I
- Page 132 and 133:
The 12th I
- Page 134 and 135:
The 12th I
- Page 136 and 137:
The 12th I
- Page 138 and 139:
to heating costs of 14,5 ct/kWh. Th
- Page 140 and 141:
The 12th I
- Page 142 and 143:
The 12th I
- Page 144 and 145:
The 12th I
- Page 146 and 147:
The 12th I
- Page 148 and 149:
academic access is facilitated as t
- Page 150 and 151:
The 12th I
- Page 152 and 153:
The 12th I
- Page 154 and 155:
The 12th I
- Page 156 and 157:
The 12th I
- Page 158 and 159:
The 12th I
- Page 160 and 161:
The 12th I
- Page 162 and 163:
1. CHP system operation in A2. Ther
- Page 164 and 165:
The 12th I
- Page 166 and 167:
is covered by operating HOB. In oth
- Page 168 and 169:
The 12th I
- Page 170 and 171:
The 12th I
- Page 172 and 173:
The 12th I
- Page 174 and 175:
The 12th I
- Page 176 and 177:
The 12th I
- Page 178 and 179:
The 12th I
- Page 180 and 181:
The 12th I
- Page 182 and 183:
The 12th I
- Page 184 and 185:
The 12th I
- Page 186 and 187:
The 12th I
- Page 188 and 189:
The 12th I
- Page 190 and 191:
The 12th I
- Page 192 and 193:
The 12th I
- Page 194 and 195:
The 12th I
- Page 196 and 197:
produce heat and electricity. Fluct
- Page 198 and 199:
The 12th I
- Page 200 and 201:
The 12th I
- Page 202 and 203:
The 12th I
- Page 204 and 205:
The 12th I
- Page 206 and 207:
The 12th I
- Page 208 and 209:
The 12th I
- Page 210 and 211:
To assure that the temperatures mea
- Page 212 and 213:
The 12th I
- Page 214 and 215:
The 12th I
- Page 216 and 217:
The 12th I
- Page 218 and 219:
The 12th I
- Page 220 and 221:
production and provide for marginal
- Page 222 and 223:
The 12th I
- Page 224 and 225:
The 12th I
- Page 226 and 227:
The 12th I
- Page 228 and 229:
The 12th I
- Page 230 and 231:
The 12th I
- Page 232 and 233:
The 12th I
- Page 234 and 235:
The 12th I
- Page 236 and 237:
The 12th I
- Page 238 and 239:
The 12th I
- Page 240 and 241:
The 12th I
- Page 242 and 243:
In addition, it can also be observe
- Page 244 and 245:
The 12th I
- Page 246 and 247:
owner is normally only interested i
- Page 248 and 249:
The 12th I
- Page 250 and 251:
The 12th I
- Page 252 and 253:
The 12th I
- Page 254 and 255:
The 12th I
- Page 256 and 257:
The 12th I
- Page 258 and 259: The 12th I
- Page 260 and 261: The 12th I
- Page 262 and 263: The 12th I
- Page 264 and 265: The 12th I
- Page 266 and 267: The 12th I
- Page 268 and 269: The 12th I
- Page 270 and 271: The 12th I
- Page 272 and 273: The 12th I
- Page 274 and 275: The 12th I
- Page 276 and 277: The 12th I
- Page 278 and 279: The 12th I
- Page 280 and 281: The 12th I
- Page 282 and 283: The 12th I
- Page 284 and 285: The 12th I
- Page 286 and 287: The 12th I
- Page 288 and 289: The 12th I
- Page 290 and 291: Stockholm district heating system a
- Page 292 and 293: The 12th I
- Page 294 and 295: The 12th I
- Page 296 and 297: The 12th I
- Page 298 and 299: The 12th I
- Page 300 and 301: The 12th I
- Page 302 and 303: The 12th I
- Page 304 and 305: The 12th I
- Page 306 and 307: The 12th I
- Page 310 and 311: The 12th I
- Page 312 and 313: The 12th I
- Page 314 and 315: The values presented do of course l
- Page 316 and 317: The 12th I
- Page 318 and 319: The 12th I
- Page 320 and 321: The 12th I
- Page 322 and 323: The 12th I
- Page 324 and 325: The 12th I
- Page 326: The 12th I