TROLL 9500 Operator's Manual - Geotech Environmental Equipment
TROLL 9500 Operator's Manual - Geotech Environmental Equipment
TROLL 9500 Operator's Manual - Geotech Environmental Equipment

Create successful ePaper yourself
Turn your PDF publications into a flip-book with our unique Google optimized e-Paper software.
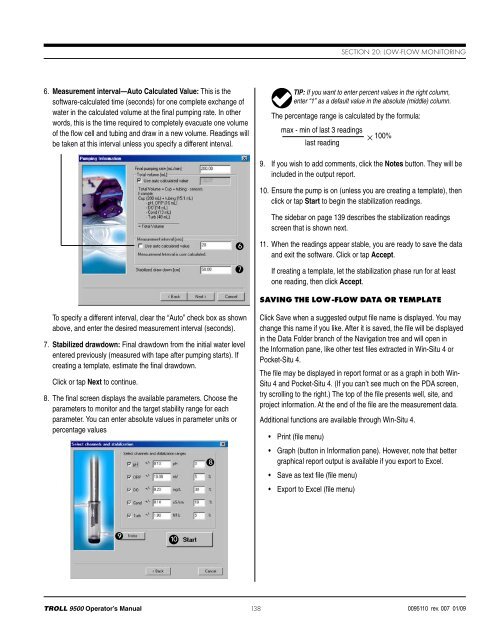
Section 20: Low-Flow Monitoring6. Measurement interval—Auto Calculated Value: This is thesoftware-calculated time (seconds) for one complete exchange ofwater in the calculated volume at the final pumping rate. In otherwords, this is the time required to completely evacuate one volumeof the flow cell and tubing and draw in a new volume. Readings willbe taken at this interval unless you specify a different interval.TIP: If you want to enter percent values in the right column,enter “1” as a default value in the absolute (middle) column.The percentage range is calculated by the formula:max - min of last 3 readings×last reading100%9. If you wish to add comments, click the Notes button. They will beincluded in the output report.10. Ensure the pump is on (unless you are creating a template), thenclick or tap Start to begin the stabilization readings.The sidebar on page 139 describes the stabilization readingsscreen that is shown next.6711. When the readings appear stable, you are ready to save the dataand exit the software. Click or tap Accept.If creating a template, let the stabilization phase run for at leastone reading, then click Accept.Saving the Low-Flow Data or TemplateTo specify a different interval, clear the “Auto” check box as shownabove, and enter the desired measurement interval (seconds).7. Stabilized drawdown: Final drawdown from the initial water levelentered previously (measured with tape after pumping starts). Ifcreating a template, estimate the final drawdown.Click or tap Next to continue.8. The final screen displays the available parameters. Choose theparameters to monitor and the target stability range for eachparameter. You can enter absolute values in parameter units orpercentage values8Click Save when a suggested output file name is displayed. You maychange this name if you like. After it is saved, the file will be displayedin the Data Folder branch of the Navigation tree and will open inthe Information pane, like other test files extracted in Win-Situ 4 orPocket-Situ 4.The file may be displayed in report format or as a graph in both Win-Situ 4 and Pocket-Situ 4. (If you can’t see much on the PDA screen,try scrolling to the right.) The top of the file presents well, site, andproject information. At the end of the file are the measurement data.Additional functions are available through Win-Situ 4.• Print (file menu)• Graph (button in Information pane). However, note that bettergraphical report output is available if you export to Excel.• Save as text file (file menu)• Export to Excel (file menu)910<strong>TROLL</strong> <strong>9500</strong> Operator’s <strong>Manual</strong>138 0095110 rev. 007 01/09