TROLL 9500 Operator's Manual - Geotech Environmental Equipment
TROLL 9500 Operator's Manual - Geotech Environmental Equipment
TROLL 9500 Operator's Manual - Geotech Environmental Equipment

Create successful ePaper yourself
Turn your PDF publications into a flip-book with our unique Google optimized e-Paper software.
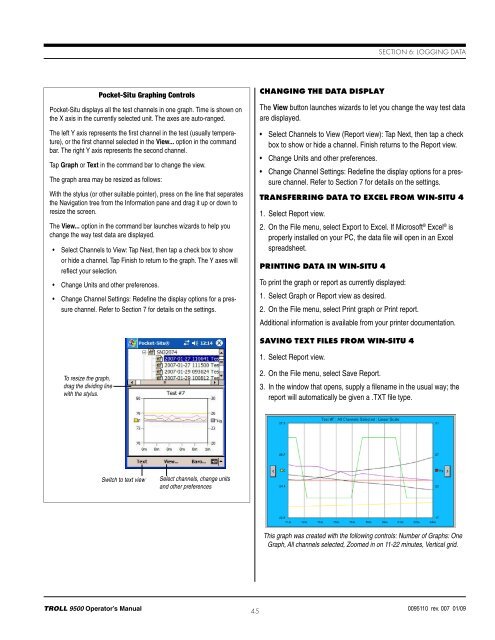
Section 6: Logging DataPocket-Situ Graphing ControlsPocket-Situ displays all the test channels in one graph. Time is shown onthe X axis in the currently selected unit. The axes are auto-ranged.The left Y axis represents the first channel in the test (usually temperature),or the first channel selected in the View... option in the commandbar. The right Y axis represents the second channel.Tap Graph or Text in the command bar to change the view.The graph area may be resized as follows:With the stylus (or other suitable pointer), press on the line that separatesthe Navigation tree from the Information pane and drag it up or down toresize the screen.The View... option in the command bar launches wizards to help youchange the way test data are displayed.• Select Channels to View: Tap Next, then tap a check box to showor hide a channel. Tap Finish to return to the graph. The Y axes willreflect your selection.• Change Units and other preferences.• Change Channel Settings: Redefine the display options for a pressurechannel. Refer to Section 7 for details on the settings.Changing the Data DisplayThe View button launches wizards to let you change the way test dataare displayed.• Select Channels to View (Report view): Tap Next, then tap a checkbox to show or hide a channel. Finish returns to the Report view.• Change Units and other preferences.• Change Channel Settings: Redefine the display options for a pressurechannel. Refer to Section 7 for details on the settings.Transferring Data to Excel from Win-Situ 41. Select Report view.2. On the File menu, select Export to Excel. If Microsoft ® Excel ® isproperly installed on your PC, the data file will open in an Excelspreadsheet.Printing Data in Win-Situ 4To print the graph or report as currently displayed:1. Select Graph or Report view as desired.2. On the File menu, select Print graph or Print report.Additional information is available from your printer documentation.Saving Text Files from Win-Situ 41. Select Report view.To resize the graph,drag the dividing linewith the stylus.2. On the File menu, select Save Report.3. In the window that opens, supply a filename in the usual way; thereport will automatically be given a .TXT file type.Switch to text viewSelect channels, change unitsand other preferencesThis graph was created with the following controls: Number of Graphs: OneGraph, All channels selected, Zoomed in on 11-22 minutes, Vertical grid.<strong>TROLL</strong> <strong>9500</strong> Operator’s <strong>Manual</strong> 450095110 rev. 007 01/09