TROLL 9500 Operator's Manual - Geotech Environmental Equipment
TROLL 9500 Operator's Manual - Geotech Environmental Equipment
TROLL 9500 Operator's Manual - Geotech Environmental Equipment

Create successful ePaper yourself
Turn your PDF publications into a flip-book with our unique Google optimized e-Paper software.
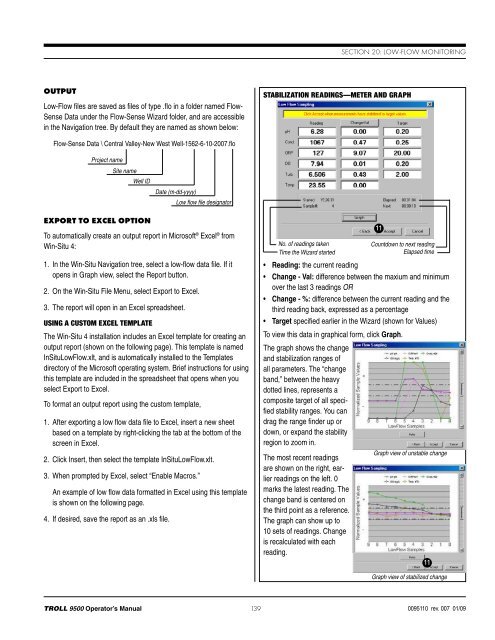
Section 20: Low-Flow MonitoringOutputLow-Flow files are saved as files of type .flo in a folder named Flow-Sense Data under the Flow-Sense Wizard folder, and are accessiblein the Navigation tree. By default they are named as shown below:Stabilization Readings—Meter and GraphFlow-Sense Data \ Central Valley-New West Well-1562-6-10-2007.floProject nameSite nameWell IDDate (m-dd-yyyy)Low flow file designatorExport to Excel OptionTo automatically create an output report in Microsoft ® Excel ® fromWin-Situ 4:1. In the Win-Situ Navigation tree, select a low-flow data file. If itopens in Graph view, select the Report button.2. On the Win-Situ File Menu, select Export to Excel.3. The report will open in an Excel spreadsheet.Using a Custom Excel TemplateThe Win-Situ 4 installation includes an Excel template for creating anoutput report (shown on the following page). This template is namedInSituLowFlow.xlt, and is automatically installed to the Templatesdirectory of the Microsoft operating system. Brief instructions for usingthis template are included in the spreadsheet that opens when youselect Export to Excel.To format an output report using the custom template,1. After exporting a low flow data file to Excel, insert a new sheetbased on a template by right-clicking the tab at the bottom of thescreen in Excel.2. Click Insert, then select the template InSituLowFlow.xlt.3. When prompted by Excel, select “Enable Macros.”An example of low flow data formatted in Excel using this templateis shown on the following page.4. If desired, save the report as an .xls file.No. of readings takenTime the Wizard started11Countdown to next readingElapsed time• Reading: the current reading• Change - Val: difference between the maxium and minimumover the last 3 readings OR• Change - %: difference between the current reading and thethird reading back, expressed as a percentage• Target specified earlier in the Wizard (shown for Values)To view this data in graphical form, click Graph.The graph shows the changeand stabilization ranges ofall parameters. The “changeband,” between the heavydotted lines, represents acomposite target of all specifiedstability ranges. You candrag the range finder up ordown, or expand the stabilityregion to zoom in.The most recent readingsare shown on the right, earlierreadings on the left. 0marks the latest reading. Thechange band is centered onthe third point as a reference.The graph can show up to10 sets of readings. Changeis recalculated with eachreading.Graph view of unstable change11Graph view of stabilized change<strong>TROLL</strong> <strong>9500</strong> Operator’s <strong>Manual</strong>139 0095110 rev. 007 01/09