TROLL 9500 Operator's Manual - Geotech Environmental Equipment
TROLL 9500 Operator's Manual - Geotech Environmental Equipment
TROLL 9500 Operator's Manual - Geotech Environmental Equipment

You also want an ePaper? Increase the reach of your titles
YUMPU automatically turns print PDFs into web optimized ePapers that Google loves.
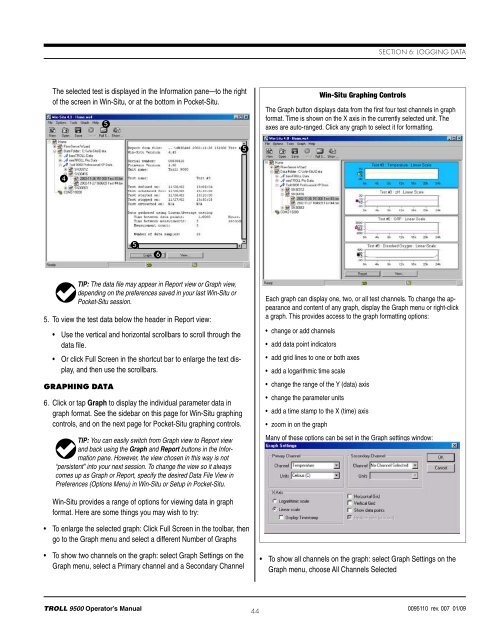
Section 6: Logging DataThe selected test is displayed in the Information pane—to the rightof the screen in Win-Situ, or at the bottom in Pocket-Situ.5Win-Situ Graphing ControlsThe Graph button displays data from the first four test channels in graphformat. Time is shown on the X axis in the currently selected unit. Theaxes are auto-ranged. Click any graph to select it for formatting.5456TIP: The data file may appear in Report view or Graph view,depending on the preferences saved in your last Win-Situ orPocket-Situ session.5. To view the test data below the header in Report view:• Use the vertical and horizontal scrollbars to scroll through thedata file.• Or click Full Screen in the shortcut bar to enlarge the text display,and then use the scrollbars.Graphing Data6. Click or tap Graph to display the individual parameter data ingraph format. See the sidebar on this page for Win-Situ graphingcontrols, and on the next page for Pocket-Situ graphing controls.TIP: You can easily switch from Graph view to Report viewand back using the Graph and Report buttons in the Informationpane. However, the view chosen in this way is not“persistent” into your next session. To change the view so it alwayscomes up as Graph or Report, specify the desired Data File View inPreferences (Options Menu) in Win-Situ or Setup in Pocket-Situ.Each graph can display one, two, or all test channels. To change the appearanceand content of any graph, display the Graph menu or right-clicka graph. This provides access to the graph formatting options:• change or add channels• add data point indicators• add grid lines to one or both axes• add a logarithmic time scale• change the range of the Y (data) axis• change the parameter units• add a time stamp to the X (time) axis• zoom in on the graphMany of these options can be set in the Graph settings window:Win-Situ provides a range of options for viewing data in graphformat. Here are some things you may wish to try:• To enlarge the selected graph: Click Full Screen in the toolbar, thengo to the Graph menu and select a different Number of Graphs• To show two channels on the graph: select Graph Settings on theGraph menu, select a Primary channel and a Secondary Channel• To show all channels on the graph: select Graph Settings on theGraph menu, choose All Channels Selected<strong>TROLL</strong> <strong>9500</strong> Operator’s <strong>Manual</strong> 440095110 rev. 007 01/09