- Page 1: The psychopathology of everyday art
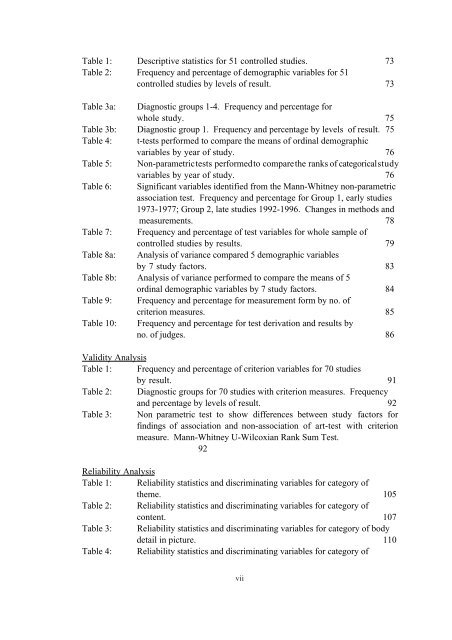
- Page 4 and 5: Table of Contents Page Number Chapt
- Page 8 and 9: quality. 113 Table 5: Reliability s
- Page 10 and 11: Table, boxplot and spreadplot 1e (b
- Page 12 and 13: Table 19: Correlation for DAPA vari
- Page 14 and 15: Acknowledgements, thanks and forewo
- Page 16 and 17: concludes on the effectiveness of t
- Page 18 and 19: or drawing progresses, relationship
- Page 20 and 21: The link between genius as a produc
- Page 22 and 23: again by a multidisciplinary team w
- Page 24 and 25: theoretical foundation relating art
- Page 26 and 27: the content of which was seemingly
- Page 28 and 29: approach. Some of the major critici
- Page 30 and 31: Gestalt Analysis Rudolph Arnheim ha
- Page 32 and 33: molar level and not by individual e
- Page 34 and 35: Attempts to lists characteristics o
- Page 36 and 37: tests are still popular in assessme
- Page 38 and 39: investigation of artwork, but few h
- Page 40 and 41: expressions of a disordered psyche.
- Page 42 and 43: own paintings, or on interpretation
- Page 44 and 45: pointing to integrative or global j
- Page 46 and 47: Chapter Two: Review of the recent l
- Page 48 and 49: etrieved from the Psychlit, which p
- Page 50 and 51: a major proportion of the study mat
- Page 52 and 53: psychopathology, something which is
- Page 54 and 55: 3 13 5 5 5 1 3 2 10 0 0 2 11 0 0 3
- Page 56 and 57:
social/developmental energy theorie
- Page 58 and 59:
advanced from all types of papers b
- Page 60 and 61:
Art therapists begin their career f
- Page 62 and 63:
talent and therefore do not fit in
- Page 64 and 65:
2. Research studies There were two
- Page 66 and 67:
Method of study or description of t
- Page 68 and 69:
olds and only 2 with over 60s. The
- Page 70 and 71:
form of this expression and how it
- Page 72 and 73:
Content: 16 studies reported change
- Page 74 and 75:
Pictures by bipolar depressives sho
- Page 76 and 77:
This section does not deal strictly
- Page 78 and 79:
correlation of art elements with de
- Page 80 and 81:
of form 154 . The formal elements w
- Page 82 and 83:
ecognise and work through the situa
- Page 84 and 85:
Conclusion The use of art was not i
- Page 86 and 87:
Thematic interpretation varied with
- Page 88 and 89:
(2) to find out how the art relates
- Page 90 and 91:
There were 7 demographic variables:
- Page 92 and 93:
No. 1 judges 2 3 4 60 No. 2 Study 3
- Page 94 and 95:
satisfactory classification as it i
- Page 96 and 97:
or non-art tests which were not see
- Page 98 and 99:
favoured (12% n=6) over post measur
- Page 100 and 101:
procedures, or publishing bias, sin
- Page 102 and 103:
Table 8b. Analysis of variance perf
- Page 104 and 105:
spread between subjective and objec
- Page 106 and 107:
are linked to those artistic charac
- Page 108 and 109:
3 Demographic variables were used f
- Page 110 and 111:
Table 2. Diagnostic groups for 70 s
- Page 112 and 113:
However, there were few tests which
- Page 114 and 115:
include recognisable or identifiabl
- Page 116 and 117:
and emotional indicators in drawing
- Page 118 and 119:
The DDS (1988) study was an explora
- Page 120 and 121:
which were not significant - and I
- Page 122 and 123:
eliability studies or studies which
- Page 124 and 125:
Thematic variables Table 1: reliabi
- Page 126 and 127:
etween grades of the same diagnosis
- Page 128 and 129:
personally expressive images than '
- Page 130 and 131:
to trees (52); size of figure (75);
- Page 132 and 133:
Table 4: reliability statistics and
- Page 134 and 135:
Line Table 5: reliability statistic
- Page 136 and 137:
Purpose or use of line contained on
- Page 138 and 139:
Shape variables (study no.) (o) obj
- Page 140 and 141:
Colour Table 7: reliability statist
- Page 142 and 143:
number of colours. Furthermore with
- Page 144 and 145:
subcategories were congruous and al
- Page 146 and 147:
(35, 46, 36, 38, 33); and indicator
- Page 148 and 149:
Summary: There are unresolved defin
- Page 150 and 151:
Summary: The effect which distingui
- Page 152 and 153:
Summary: Striking variation in glob
- Page 154 and 155:
Reliability: Perseveration is a non
- Page 156 and 157:
(including schizophrenics) against
- Page 158 and 159:
The studies are difficult to sum up
- Page 160 and 161:
indicate greater agreement (even th
- Page 162 and 163:
Two weaknesses lie in the simple ca
- Page 164 and 165:
of drawing areas and to quantify wh
- Page 166 and 167:
Is Meta Analysis appropriate for th
- Page 168 and 169:
techniques which compensate for unr
- Page 170 and 171:
drawing evaluation with comments fr
- Page 172 and 173:
There are few answers to this criti
- Page 174 and 175:
attention to overall effect sizes t
- Page 176 and 177:
The 'File Drawer Problem' (refer ba
- Page 178 and 179:
Table 2. All variables for 11 studi
- Page 180 and 181:
Less than a third of the drawing ar
- Page 182 and 183:
Case study and controlled research
- Page 184 and 185:
potential for psychiatric populatio
- Page 186 and 187:
only are discussed (indicators whic
- Page 188 and 189:
specific areas of positivity could
- Page 190 and 191:
Rating Guide (Hacking & Foreman 199
- Page 192 and 193:
Table 2: Summary table of expected
- Page 194 and 195:
Previous methods of assessing atomi
- Page 196 and 197:
cases as to whether informed consen
- Page 198 and 199:
It was decided to use a large mixed
- Page 200 and 201:
paintings was not reliable enough t
- Page 202 and 203:
computed on any of these levels. Gr
- Page 204 and 205:
The DAPA (Descriptive Assessment fo
- Page 206 and 207:
The extremes of the distribution fo
- Page 208 and 209:
The difficulty with using t-tests i
- Page 210 and 211:
addition it leaves out other variab
- Page 212 and 213:
nebulous for reasonable conclusions
- Page 214 and 215:
identified were included in the stu
- Page 216 and 217:
DISCUSSION • The validity of the
- Page 218 and 219:
and the test used terminology which
- Page 220 and 221:
How the data were structured Althou
- Page 222 and 223:
How well does the method agree? Tab
- Page 224 and 225:
- 76% - of the scales were rated wi
- Page 226 and 227:
Green Blue Brown White Black Intens
- Page 228 and 229:
All of the scales were understood b
- Page 230 and 231:
Table 1: Demographics for experimen
- Page 232 and 233:
classify, even as in and out patien
- Page 234 and 235:
score for each subject was a ratio
- Page 236 and 237:
each participant received the same
- Page 238 and 239:
Results Interaction effects: The me
- Page 240 and 241:
was no evidence of impoverishment f
- Page 242 and 243:
Chapter 5. Results This chapter pre
- Page 244 and 245:
appendix 2) and these were left in
- Page 246 and 247:
fairly small, less than 0.1, indica
- Page 248 and 249:
Red, Green, Black, Drawn Line, Emot
- Page 250 and 251:
1. Neither schizophrenics nor depre
- Page 252 and 253:
schizophrenia was indistinguishable
- Page 254 and 255:
Black: Black is the darkest colour
- Page 256 and 257:
the other groups since no confidenc
- Page 258 and 259:
Drawn line: The normal distribution
- Page 260 and 261:
proportions of empty space in the p
- Page 262 and 263:
1. Depressives showed significantly
- Page 264 and 265:
function contributed significantly
- Page 266 and 267:
the discriminant analysis. It will
- Page 268 and 269:
Subordinate Analyses Interaction ef
- Page 270 and 271:
Table 15: showing correlations betw
- Page 272 and 273:
2. Intensity showed a correlation o
- Page 274 and 275:
quality and reliability of their me
- Page 276 and 277:
as being unreliable, would be metho
- Page 278 and 279:
There would be a correlation betwee
- Page 280 and 281:
Figures 3. Map of Associations betw
- Page 282 and 283:
Schizophrenic pictures showed corre
- Page 284 and 285:
The DAPA results for depression are
- Page 286 and 287:
abusers 308 , but not the schizophr
- Page 288 and 289:
Control pictures showed the only as
- Page 290 and 291:
yellow Structural variables Figures
- Page 292 and 293:
directly, to answer this question.
- Page 294 and 295:
yellow and green, its removal would
- Page 296 and 297:
Schizophrenics used little colour e
- Page 298 and 299:
directly to the environment; assess
- Page 300 and 301:
influence on apparent negativity. W
- Page 302 and 303:
ather than for schizophrenia 335 .
- Page 304 and 305:
Supporting this point, the focus ar
- Page 306 and 307:
Several kinds of difficulties were
- Page 308 and 309:
portraiture, so it is difficult to
- Page 310 and 311:
1, as generally the scores for schi
- Page 312 and 313:
numbers resulted in differentiation
- Page 314 and 315:
at or above the usual level. Person
- Page 316 and 317:
size (_=0.36) which contrasts wildl
- Page 318 and 319:
sets had all the identified high ef
- Page 320 and 321:
hospital; the mean of up to 10 pain
- Page 322 and 323:
eliability of the test and shows th
- Page 324 and 325:
Chapter 7. Conclusion This thesis r
- Page 326 and 327:
probably because the form variables
- Page 328 and 329:
etween different groups of patients
- Page 330 and 331:
previously unexplored, which comple
- Page 332 and 333:
statistical tests and missing data
- Page 334 and 335:
psychopathology in clinical diagnos
- Page 336 and 337:
6 scales to categorise commonalitie
- Page 338 and 339:
Orientation of the researcher, what
- Page 340 and 341:
Validity Analysis of controlled stu
- Page 342 and 343:
_ 2 _ _ _ _ 2 _ .3_ 1 1 _ B _ 2 1 2
- Page 344 and 345:
6j. Standard differences from mean
- Page 346 and 347:
Correlation table 16 for DAPA varia
- Page 348 and 349:
Correlation table 20 for DAPA varia
- Page 350 and 351:
Correlation table 19 for DAPA varia
- Page 352 and 353:
eliefs to depression. cannot be mat
- Page 354 and 355:
Table 4: summarising changes or sig
- Page 356 and 357:
Table 6: summarising changes or sig
- Page 358 and 359:
13 22y. male Violence and substance
- Page 360 and 361:
Crosstabulations 1-6: contingency t
- Page 362 and 363:
Crosstabulation 3: ORIENTATION By B
- Page 364 and 365:
Crosstabulation 5: FORM OF EXPRESSI
- Page 366 and 367:
Reliability Study Chapter 4 - Metho
- Page 368 and 369:
Raters R1-7 score for ORANGE, pics
- Page 370 and 371:
-4_ _ R-A _________________________
- Page 372 and 373:
e _ _ -4_ _ R-A ___________________
- Page 374 and 375:
c _ _ e _ _ -4_ _ R-A _____________
- Page 376 and 377:
Appendix 3 Table of Authorities 1.
- Page 378 and 379:
connection from victim to victimize
- Page 380 and 381:
Hodnett, M.L. (1973), A broader vie
- Page 382 and 383:
Muller-Braunschweig, H. (1975), Psy
- Page 384 and 385:
Siegel, L. (1988), The use of mural
- Page 386 and 387:
Psycho-Analysis , V.6(2):183-200. 3
- Page 388 and 389:
10 Fagin, I. (1983), Images of grow
- Page 390 and 391:
Institute Creative Arts Therapy Rev
- Page 392 and 393:
psychotics, Perceptual and Motor Sk
- Page 394 and 395:
Appendix 4 Development of the Descr
- Page 396 and 397:
D.A.P.A. DESCRIPTIVE ASSESSMENT OF
- Page 398 and 399:
INTENSITY DEFINITION: Firstly, the
- Page 400 and 401:
SPACE >10% >25% >55% >80% >100% DEF
- Page 402 and 403:
Part 2 Rating Sheet for DAPA: Hacki
- Page 404 and 405:
Rating Sheet for Casenotes DAPA ver
- Page 406 and 407:
D.A.P.A. DESCRIPTIVE ASSESSMENT OF
- Page 408 and 409:
Intensity DEFINITION: The brightnes
- Page 410 and 411:
Form sheet for Artists. Side 2. DAP
- Page 412 and 413:
Appendix 5 Permission for study, in
- Page 414 and 415:
North Staffordshire Health Authorit
- Page 416 and 417:
Psychiatry Dept., School P.G. Medic
- Page 418 and 419:
Bibliography 418
- Page 420 and 421:
Psychiatry, 152(suppl.1): 33-57. Ca
- Page 422 and 423:
V.11: 139-143. Kaplan, F.F. (1996),
- Page 424 and 425:
Reuven, S.K. (1998), Reversal of a
- Page 426 and 427:
Blackwell. Arrington, D. (1992), Ar
- Page 428 and 429:
MacGregor, J.D. (1989), The Discove
- Page 430 and 431:
Research (ICD-10 DCR), Geneva: Auth