- Page 1 and 2:
Ms. Debbie Edwards Director, Office
- Page 3 and 4:
National Marine Fisheries Service E
- Page 5 and 6:
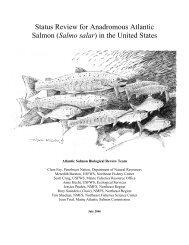
Snake River Spring/Summer-Run Chino
- Page 7 and 8:
Commercial, Recreational, and Subsi
- Page 9 and 10:
Critical Habitat Risk Hypotheses ba
- Page 11 and 12:
Table of Figures Figure 1. Stressor
- Page 13 and 14:
Table of Tables Table 1. Registered
- Page 15 and 16:
Table 31. Area of Land Use Categori
- Page 17 and 18:
Table 67. . Examples of published f
- Page 19 and 20:
Agency: Activities Considered: Nati
- Page 21 and 22:
This Opinion is based on NMFS’ re
- Page 23 and 24:
activities that may improve EPA’s
- Page 25 and 26:
affect but is not likely to adverse
- Page 27 and 28:
On November 13, 2008, EPA provided
- Page 29 and 30:
On January 21, 2009, the agencies a
- Page 31 and 32:
in California, Idaho, Oregon, and W
- Page 33 and 34:
On that same date, EPA e-mailed NMF
- Page 35 and 36:
After registering a pesticide, EPA
- Page 37 and 38:
isk assessment. With these and othe
- Page 39 and 40:
Typically, formulations are combine
- Page 41 and 42:
EPA also issued generic and product
- Page 43 and 44:
pecans, peppers, pistachios, plums,
- Page 45 and 46:
Use Site plants, woody plants CRP a
- Page 47 and 48:
are subject to a four year phase-ou
- Page 49 and 50:
Table 2. Registered uses and applic
- Page 51 and 52:
mildews and other fungal diseases.
- Page 53 and 54:
methomyl are 32.4 lb a.i./acre/year
- Page 55 and 56:
would not likely adversely affect C
- Page 57 and 58:
In the final steps of our analyses,
- Page 59 and 60:
Evidence Available for the Consulta
- Page 61 and 62:
sustaining in the natural environme
- Page 63 and 64:
Stressors of the Action (see Figure
- Page 65 and 66:
Species Risk Hypotheses We construc
- Page 67 and 68:
habitats is then assessed. This por
- Page 69 and 70:
The problem formulation phase as ar
- Page 71 and 72:
Risk Characterization We follow the
- Page 73 and 74:
the probability of risk. In the Ris
- Page 75 and 76:
Figure 5. Map showing extent of inl
- Page 77 and 78:
Opinion. Summaries of the status an
- Page 79 and 80:
Chinook salmon are dependent on the
- Page 81 and 82:
Eureka Figure 6. CC Chinook salmon
- Page 83 and 84:
Table 6. CC Chinook salmon--prelimi
- Page 85 and 86:
Table 7 identifies populations with
- Page 87 and 88:
The CV drainage as a whole is estim
- Page 89 and 90:
have greatly reduced or eliminated
- Page 91 and 92:
Portland Salem Figure 9. LCR Chinoo
- Page 93 and 94:
important life history type remains
- Page 95 and 96:
Table 9. UCR Chinook salmon - preli
- Page 97 and 98:
In the most recent five-year geomet
- Page 99 and 100:
Figure 11. Puget Sound Chinook dist
- Page 101 and 102:
Status and Trends Puget Sound Chino
- Page 103 and 104:
flow, temperature, sediment load, w
- Page 105 and 106:
San Francisco Figure 12. Sacramento
- Page 107 and 108:
of historic spawning areas. Additio
- Page 109 and 110:
Status and Trends SR fall-run Chino
- Page 111 and 112:
Critical Habitat Critical habitat f
- Page 113 and 114:
Portland Seattle Spokane Figure 14.
- Page 115 and 116:
and five-year old fish, after two t
- Page 117 and 118:
surface and ground water and degrad
- Page 119 and 120:
Life History UWR Chinook salmon exh
- Page 121 and 122:
Bay, California. Historically, chum
- Page 123 and 124:
quality in the freshwater, estuarin
- Page 125 and 126:
Life History Chum salmon return to
- Page 127 and 128:
catastrophic events. Overall, the p
- Page 129 and 130:
Figure 17. Hood Canal Summer-run Ch
- Page 131 and 132:
improvements in 2000, with upward t
- Page 133 and 134:
ground water and degrade water qual
- Page 135 and 136:
San Francisco Figure 18. CCC Coho s
- Page 137 and 138:
Information on the abundance and pr
- Page 139 and 140:
Table 16 identifies populations wit
- Page 141 and 142:
Life History Although run time vari
- Page 143 and 144:
programs. The three major river sys
- Page 145 and 146:
Data on population abundance and tr
- Page 147 and 148:
Figure 21. Oregon Coast Coho salmon
- Page 149 and 150:
Preliminary spawner survey data for
- Page 151 and 152:
channels, backwaters, terrace tribu
- Page 153 and 154:
Figure 22. Ozette Lake Sockeye salm
- Page 155 and 156:
the 1997 status review due to resam
- Page 157 and 158:
Seattle Portland Figure 23. SR Sock
- Page 159 and 160:
Adult returns to Redfish Lake durin
- Page 161 and 162:
esume migration in early spring to
- Page 163 and 164:
Central California Coast Steelhead
- Page 165 and 166:
Status and Trends The CCC steelhead
- Page 167 and 168:
San Francisco Figure 25. California
- Page 169 and 170:
and Jackson 1996; McEwan 2001). Ste
- Page 171 and 172:
Olympia Portland Salem Figure 26. L
- Page 173 and 174:
hatchery fish in naturally-spawning
- Page 175 and 176:
species includes the only populatio
- Page 177 and 178:
Life History Most MCR steelhead smo
- Page 179 and 180:
Critical Habitat Critical habitat w
- Page 181 and 182:
Eureka Figure 28. Northern Californ
- Page 183 and 184:
may affect steelhead migration patt
- Page 185 and 186:
Of the 21 populations in the Puget
- Page 187 and 188:
Seattle Spokane Figure 30. SR Basin
- Page 189 and 190:
and spawner estimates for the Tucan
- Page 191 and 192:
San Jose Figure 31. S-CCC steelhead
- Page 193 and 194:
Figure 32. Southern California stee
- Page 195 and 196:
extinction,” with the remaining 1
- Page 197 and 198:
Portland Figure 33. UCR Steelhead d
- Page 199 and 200:
“low” for the Wenatchee and Met
- Page 201 and 202:
Figure 34. UWR Steelhead distributi
- Page 203 and 204:
Molalla/Pudding, Yamhill, Tualatin,
- Page 205 and 206:
Natural Mortality Factors Available
- Page 207 and 208:
Marine Mammal Predation Marine mamm
- Page 209 and 210:
downstream of Bonneville Dam. Socke
- Page 211 and 212:
Oceanographic Features and Climatic
- Page 213 and 214:
coincides with relatively poor ocea
- Page 215 and 216:
from streams in watersheds with agr
- Page 217 and 218:
chemicals used has decreased (Table
- Page 219 and 220:
California, Idaho, Oregon, and Wash
- Page 221 and 222:
to disease, decrease the ability of
- Page 223 and 224:
characterized by emergent aquatic p
- Page 225 and 226:
subregions and accounting units for
- Page 227 and 228:
Region USGS Subregion Central Calif
- Page 229 and 230:
Table 31. Area of Land Use Categori
- Page 231 and 232:
Table 33. Land uses and population
- Page 233 and 234:
(Table 34). See species ESU/DPS map
- Page 235 and 236:
undeveloped sites in the Santa Ana
- Page 237 and 238:
and grazing. Dams and water diversi
- Page 239 and 240:
Artificial Propagation Anadromous f
- Page 241 and 242:
water resources is handled by Calif
- Page 243 and 244:
containers at time of use. • Cond
- Page 245 and 246:
Table 36. Area of land use categori
- Page 247 and 248:
Columbia River Basin The most notab
- Page 249 and 250:
Ranching practices have led to incr
- Page 251 and 252:
17% of mainstem Yakima River sample
- Page 253 and 254:
detected in samples from all sites,
- Page 255 and 256:
Whitney 1979). Similarly, over one
- Page 257 and 258:
nation’s silver output has come f
- Page 259 and 260:
(USBR 1998 in (FCRPS 2008); providi
- Page 261 and 262:
The States of Oregon and Wasington
- Page 263 and 264:
Columbia River chum salmon are not
- Page 265 and 266:
including brown and brook trout, At
- Page 267 and 268:
density residential with some agric
- Page 269 and 270:
Although urban areas occupy only 2%
- Page 271 and 272:
Habitat Modification Much of the re
- Page 273 and 274:
Table 42. Pollutants of Concern in
- Page 275 and 276:
the 1950s. The vast majority of the
- Page 277 and 278:
pugettensis). An NPDES permit is re
- Page 279 and 280:
Habitat loss through wetland fills
- Page 281 and 282:
afted and moved to market or downst
- Page 283 and 284:
Oregon is in the process of develop
- Page 285 and 286:
Effects of the Proposed Action The
- Page 287 and 288:
Carbaryl dissipates in the environm
- Page 289 and 290:
high water solubility, low Kow, and
- Page 291 and 292:
Table 46. Environmental fate charac
- Page 293 and 294:
Species General Life History Descri
- Page 295 and 296:
Table 48. Examples of registered us
- Page 297 and 298:
Table 49. PRZM-EXAMS exposure estim
- Page 299 and 300:
estimate do not represent the highe
- Page 301 and 302:
BE provides a peak EEC of 5.5 μg/L
- Page 303 and 304:
alcoves, channel edge sloughs, over
- Page 305 and 306:
Carbaryl can also be applied at 8 l
- Page 307 and 308:
habitat had a downwind width of 10
- Page 309 and 310:
Depth of aquatic habitat (meters) B
- Page 311 and 312:
monitored in California, Idaho, Ore
- Page 313 and 314:
5.2 μg/L for carbofuran, 0.0150 -
- Page 315 and 316:
Summary information for carbaryl, c
- Page 317 and 318:
after flooding (Nicosia, Carr et al
- Page 319 and 320:
pesticide concentrations in the dis
- Page 321 and 322:
flowing water habitats, it is not s
- Page 323 and 324:
egistered products that contain mor
- Page 325 and 326:
potential ingredients in tank mixtu
- Page 327 and 328:
low maximum application rate. Howev
- Page 329 and 330:
occupy shoreline habitats of only a
- Page 331 and 332:
vertebrates and invertebrates (Walk
- Page 333 and 334:
Temperature and toxicity We found n
- Page 335 and 336:
exposure concentrations. Moreover,
- Page 337 and 338:
Summary of Toxicity Information Pre
- Page 339 and 340:
at several times during an experime
- Page 341 and 342:
Table 64. Assessment endpoint toxic
- Page 343 and 344:
fish, number of eggs per mature fem
- Page 345 and 346:
varigatus), an estuarine species, b
- Page 347 and 348:
included a NOAEC of 9.8 μg/L and a
- Page 349 and 350:
730 μg/L for D. magna (freshwater
- Page 351 and 352:
TEP) are contained in Appendix D-1.
- Page 353 and 354:
the uncertainties related to experi
- Page 355 and 356:
capacity (Little and Finger 1990).
- Page 357 and 358:
consumed relative to unexposed fish
- Page 359 and 360:
24 hr exposure (Zinkl, Shea et al.
- Page 361 and 362:
We located studies that measured ol
- Page 363 and 364:
endpoints of salmonids remains a re
- Page 365 and 366:
items (Courtemanch and Gibbs 1980;
- Page 367 and 368:
single pulse of chlorpyrifos was in
- Page 369 and 370:
Table 65. Study designs and results
- Page 371 and 372:
Chemical Taxa/species Assessment me
- Page 373 and 374:
Chemical Taxa/species carbofuran ca
- Page 375 and 376:
Chemical Taxa/species carbofuran ca
- Page 377 and 378:
macroinvertebrate community did not
- Page 379 and 380:
Jardine, MacLatchy et al. 2005; Luo
- Page 381 and 382: Risk Characterization In this secti
- Page 383 and 384: survival appears to be the most sen
- Page 385 and 386: factor in the degree of toxicity of
- Page 387 and 388: Figure 41. Methomyl exposure concen
- Page 389 and 390: Table 67. . Examples of published f
- Page 391 and 392: Additionally, the macroinvertebrate
- Page 393 and 394: Measured Concentrations in Willapa
- Page 395 and 396: up to 100 m off the carbaryl applic
- Page 397 and 398: average initial concentration from
- Page 399 and 400: • Unrelated (0): Conclusive evide
- Page 401 and 402: the fish to determine the cause of
- Page 403 and 404: Dose-addition assumes the cumulativ
- Page 405 and 406: Table 73. Predicted AChE inhibition
- Page 407 and 408: habitats during aerial applications
- Page 409 and 410: The second line of evidence is whet
- Page 411 and 412: D. Impair swimming which leads to r
- Page 413 and 414: F. Exposure to mixtures of carbaryl
- Page 415 and 416: used surfactant/adjuvant mixed with
- Page 417 and 418: In a second modeling exercise, we t
- Page 419 and 420: Carbaryl’s thresholds for the fou
- Page 421 and 422: Table 75. Modeled output for Stream
- Page 423 and 424: Table 77. Modeled output for Sockey
- Page 425 and 426: The likelihood of scenarios 2 and 3
- Page 427 and 428: The three insecticides are highly t
- Page 429 and 430: A. B. C. Figure 43. Probability plo
- Page 431: elatively low survival EC50 values
- Page 435 and 436: Figure 45. Percent change in lambda
- Page 437 and 438: Table 80. Multiple application scen
- Page 439 and 440: Because olfaction plays an importan
- Page 441 and 442: expect co-occurrence of the three i
- Page 443 and 444: support one or more lifestages. For
- Page 445 and 446: We attempted to compare expected co
- Page 447 and 448: Cumulative Effects Cumulative effec
- Page 449 and 450: entry into freshwater systems. Carb
- Page 451 and 452: Integration and Synthesis The Integ
- Page 453 and 454: carbofuran applications could cause
- Page 455 and 456: The Status of Listed Resources and
- Page 457 and 458: also exposed to poor water quality
- Page 459 and 460: Given the life history of LCR Chino
- Page 461 and 462: Chinook salmon. Furthermore, there
- Page 463 and 464: all three a.i.s are expected to be
- Page 465 and 466: completing migration to the Pacific
- Page 467 and 468: The major threats to this ESU ident
- Page 469 and 470: Land use data indicate that the Col
- Page 471 and 472: Central California Coast Coho Salmo
- Page 473 and 474: Pesticide use and detections in LCR
- Page 475 and 476: effects. In several streams, one or
- Page 477 and 478: ESU is evergreen forest. Between 19
- Page 479 and 480: miles where agricultural crops are
- Page 481 and 482: The Status of Listed Resources and
- Page 483 and 484:
carbofuran application to potatoes,
- Page 485 and 486:
The major threats to this DPS ident
- Page 487 and 488:
lowland areas (below 1,000 ft eleva
- Page 489 and 490:
consequences and subsequent populat
- Page 491 and 492:
and surface waters within the heavi
- Page 493 and 494:
1994). Most juvenile steelhead spen
- Page 495 and 496:
salmon, Northern California steelhe
- Page 497 and 498:
natural cover such as submerged and
- Page 499 and 500:
The precise change in the conservat
- Page 501 and 502:
coho salmon, LCR coho salmon, South
- Page 503 and 504:
Table 81. Jeopardy and Non-Jeopardy
- Page 505 and 506:
Reasonable and Prudent Alternatives
- Page 507 and 508:
The RPA is comprised of six require
- Page 509 and 510:
Table 83. Mandatory pesticide no ap
- Page 511 and 512:
items will die from these exposures
- Page 513 and 514:
action will attain this level in th
- Page 515 and 516:
proposed action. Therefore, inciden
- Page 517 and 518:
1. Minimize the amount and extent o
- Page 519 and 520:
met within the next 15 years, then
- Page 521 and 522:
Arunachalam, S., K. Jeyalakshmi, et
- Page 523 and 524:
Bortleson, G. C. and J. C. Ebbert (
- Page 525 and 526:
CDFG (1995). "Letter dated 30 March
- Page 527 and 528:
Davies, P. E. and L. S. J. Cook (19
- Page 529 and 530:
FCRPS (2008). "Endangered Species A
- Page 531 and 532:
Haggerty, M. J., A. C. Ritchie, et
- Page 533 and 534:
IEPSPWT (1999). "Monitoring, assess
- Page 535 and 536:
government from 1896 to 1945." Repo
- Page 537 and 538:
Matthews, G. M. and R. S. Waples (1
- Page 539 and 540:
NMFS (2004). Five-year integrated p
- Page 541 and 542:
PSAT (2004). "State of the Sound 20
- Page 543 and 544:
Schroder, S. L. (1977). "Assessment
- Page 545 and 546:
Tufts, D. F. (1990). "Control of bu
- Page 547 and 548:
Williams, A. K. and C. R. Sova (196
- Page 549 and 550:
Introduction To assess the potentia
- Page 551 and 552:
ocean-type and stream-type Chinook
- Page 553 and 554:
incorporates empirical data when av
- Page 555 and 556:
given a percentile value of 50 (i.e
- Page 557 and 558:
species-appropriate growth period (
- Page 559 and 560:
For Figure 3C, an exposure pulse wo
- Page 561 and 562:
the n x n square matrix (A) by assi
- Page 563 and 564:
spawn (Pess et al. 2002). Survival
- Page 565 and 566:
distributed survival and reproducti
- Page 567 and 568:
Figure 1: Life-History Graphs and T
- Page 569 and 570:
Table 1. List of values used for co
- Page 571 and 572:
Table 4. Matrix transition element
- Page 573 and 574:
Figure 2. 555
- Page 575 and 576:
Figure 4. 557
- Page 577 and 578:
Brewer, S.K., Little, E.E., DeLonay
- Page 579 and 580:
Higgs, D.A., MacDonald, J.S., Levin
- Page 581 and 582:
Morgan, M.J., and Kiceniuk, J.W. 19
- Page 583 and 584:
Scholz, N.L., Truelove, N.K., Frenc
- Page 585 and 586:
Appendix 2. Species and Population
- Page 587 and 588:
Chinook Salmon (continued) ESU Popu
- Page 589 and 590:
Chum Salmon ESU Population λ - H=0
- Page 591 and 592:
Coho Salmon (continued) ESU Populat
- Page 593 and 594:
Steelhead (continued) DPS Populatio
- Page 595 and 596:
Appendix 3: Abbreviations 7-DADMax
- Page 597 and 598:
FQPA Food Quality Protection Act ft
- Page 599 and 600:
PPE Personal Protection Equipment P
- Page 601 and 602:
Appendix 4: Glossary 303(d) waters
- Page 603 and 604:
Salmon fall to head upriver to its
- Page 605 and 606:
Main channel The stream channel tha
- Page 607 and 608:
Smolt A juvenile salmon or steelhea
- Page 609:
WQS “A water quality standard def