Crop Diversification in the Asia-Pacific region - United Nations in ...
Crop Diversification in the Asia-Pacific region - United Nations in ...
Crop Diversification in the Asia-Pacific region - United Nations in ...
- No tags were found...

You also want an ePaper? Increase the reach of your titles
YUMPU automatically turns print PDFs into web optimized ePapers that Google loves.
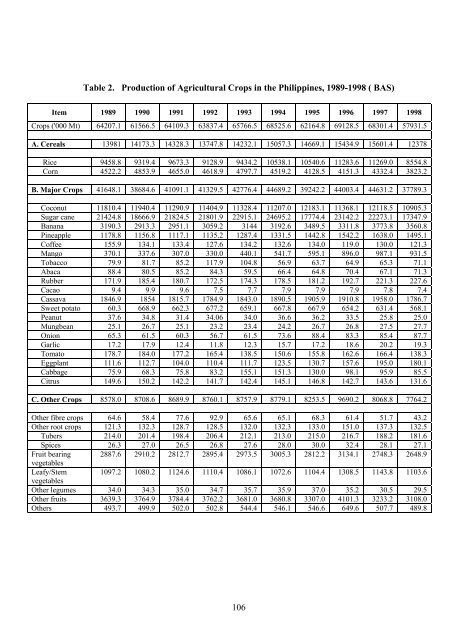
Table 2. Production of Agricultural <strong>Crop</strong>s <strong>in</strong> <strong>the</strong> Philipp<strong>in</strong>es, 1989-1998 ( BAS)Item 1989 1990 1991 1992 1993 1994 1995 1996 1997 1998<strong>Crop</strong>s ('000 Mt) 64207.1 61566.5 64109.3 63837.4 65766.5 68525.6 62164.8 69128.5 68301.4 57931.5A. Cereals 13981 14173.3 14328.3 13747.8 14232.1 15057.3 14669.1 15434.9 15601.4 12378Rice 9458.8 9319.4 9673.3 9128.9 9434.2 10538.1 10540.6 11283.6 11269.0 8554.8Corn 4522.2 4853.9 4655.0 4618.9 4797.7 4519.2 4128.5 4151.3 4332.4 3823.2B. Major <strong>Crop</strong>s 41648.1 38684.6 41091.1 41329.5 42776.4 44689.2 39242.2 44003.4 44631.2 37789.3Coconut 11810.4 11940.4 11290.9 11404.9 11328.4 11207.0 12183.1 11368.1 12118.5 10905.3Sugar cane 21424.8 18666.9 21824.5 21801.9 22915.1 24695.2 17774.4 23142.2 22273.1 17347.9Banana 3190.3 2913.3 2951.1 3059.2 3144 3192.6 3489.5 3311.8 3773.8 3560.8P<strong>in</strong>eapple 1178.8 1156.8 1117.1 1135.2 1287.4 1331.5 1442.8 1542.2 1638.0 1495.1Coffee 155.9 134.1 133.4 127.6 134.2 132.6 134.0 119.0 130.0 121.3Mango 370.1 337.6 307.0 330.0 440.1 541.7 595.1 896.0 987.1 931.5Tobacco 79.9 81.7 85.2 117.9 104.8 56.9 63.7 64.9 65.3 71.1Abaca 88.4 80.5 85.2 84.3 59.5 66.4 64.8 70.4 67.1 71.3Rubber 171.9 185.4 180.7 172.5 174.3 178.5 181.2 192.7 221.3 227.6Cacao 9.4 9.9 9.6 7.5 7.7 7.9 7.9 7.9 7.8 7.4Cassava 1846.9 1854 1815.7 1784.9 1843.0 1890.5 1905.9 1910.8 1958.0 1786.7Sweet potato 60.3 668.9 662.3 677.2 659.1 667.8 667.9 654.2 631.4 568.1Peanut 37.6 34.8 31.4 34.06 34.0 36.6 36.2 33.5 25.8 25.0Mungbean 25.1 26.7 25.1 23.2 23.4 24.2 26.7 26.8 27.5 27.7Onion 65.3 61.5 60.3 56.7 61.5 73.6 88.4 83.3 85.4 87.7Garlic 17.2 17.9 12.4 11.8 12.3 15.7 17.2 18.6 20.2 19.3Tomato 178.7 184.0 177.2 165.4 138.5 150.6 155.8 162.6 166.4 138.3Eggplant 111.6 112.7 104.0 110.4 111.7 123.5 130.7 157.6 195.0 180.1Cabbage 75.9 68.3 75.8 83.2 155.1 151.3 130.0 98.1 95.9 85.5Citrus 149.6 150.2 142.2 141.7 142.4 145.1 146.8 142.7 143.6 131.6C. O<strong>the</strong>r <strong>Crop</strong>s 8578.0 8708.6 8689.9 8760.1 8757.9 8779.1 8253.5 9690.2 8068.8 7764.2O<strong>the</strong>r fibre crops 64.6 58.4 77.6 92.9 65.6 65.1 68.3 61.4 51.7 43.2O<strong>the</strong>r root crops 121.3 132.3 128.7 128.5 132.0 132.3 133.0 151.0 137.3 132.5Tubers 214.0 201.4 198.4 206.4 212.1 213.0 215.0 216.7 188.2 181.6Spices 26.3 27.0 26.5 26.8 27.6 28.0 30.0 32.4 28.1 27.1Fruit bear<strong>in</strong>g 2887.6 2910.2 2812.7 2895.4 2973.5 3005.3 2812.2 3134.1 2748.3 2648.9vegetablesLeafy/Stem 1097.2 1080.2 1124.6 1110.4 1086.1 1072.6 1104.4 1308.5 1143.8 1103.6vegetablesO<strong>the</strong>r legumes 34.0 34.3 35.0 34.7 35.7 35.9 37.0 35.2 30.5 29.5O<strong>the</strong>r fruits 3639.3 3764.9 3784.4 3762.2 3681.0 3680.8 3307.0 4101.3 3233.2 3108.0O<strong>the</strong>rs 493.7 499.9 502.0 502.8 544.4 546.1 546.6 649.6 507.7 489.8106