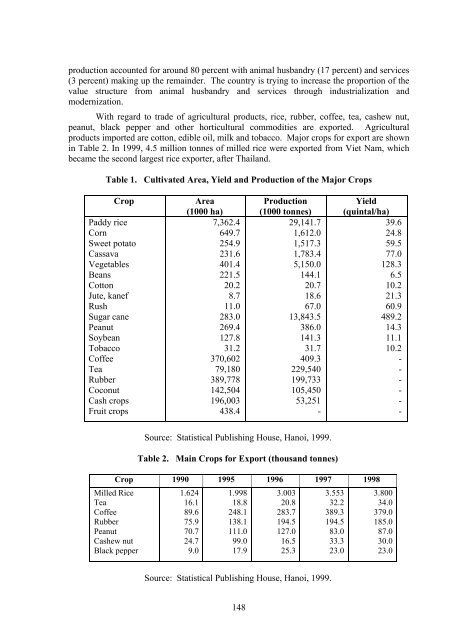
CROP DIVERSIFICATION IN VIET NAMNguyen Van Luat *1. INTRODUCTION<strong>Crop</strong> diversification as understood <strong>in</strong> Viet Nam is def<strong>in</strong>ed as <strong>the</strong> strategy of shift<strong>in</strong>gfrom less profitable to more profitable crops, chang<strong>in</strong>g of variety and cropp<strong>in</strong>g system,<strong>in</strong>creas<strong>in</strong>g exports and competitiveness <strong>in</strong> both domestic and <strong>in</strong>ternational markets,protect<strong>in</strong>g <strong>the</strong> environment, and mak<strong>in</strong>g conditions favourable for comb<strong>in</strong><strong>in</strong>g Agriculture-Fishery-Forestry-Livestock.Before 1989, when Viet Nam was a net food importer, crop diversification wasstudied under <strong>the</strong> National <strong>Crop</strong>p<strong>in</strong>g Systems Project based on rice and under <strong>the</strong>International Farm<strong>in</strong>g Systems Network, coord<strong>in</strong>ated by <strong>the</strong> International Rice ResearchInstitute (IRRI). The Project aimed ma<strong>in</strong>ly to <strong>in</strong>crease food production.2. CROP PRODUCTION AND ECONOMIC SCENARIO2.1 <strong>Crop</strong> ProductionThere are 18 major food crops, <strong>in</strong> addition to <strong>the</strong> ma<strong>in</strong> fruit species, cultivated <strong>in</strong> VietNam. The cultivated area, yield and production of <strong>the</strong>se crops are presented <strong>in</strong> Table 1. Riceoccupies around 85 percent of <strong>the</strong> total area under rice, corn, sweet potato and cassava.Data from Statistical Publish<strong>in</strong>g House (Hanoi, 1999) show that <strong>the</strong> total area undercrops was <strong>in</strong>creased by 2,665,000 ha from 1990 to 1998. The <strong>in</strong>crease of food crop area was<strong>the</strong> lowest (20.1 percent). The perennial <strong>in</strong>dustrial crop area was <strong>the</strong> highest (83.4 percent).Vegetables, annual <strong>in</strong>dustrial crops and fruit crops, <strong>in</strong>creased by 50 percent as compared to<strong>the</strong> extents of 1990. <strong>Diversification</strong> on rice land has decreased, especially <strong>in</strong> <strong>the</strong> MekongDelta, because of <strong>the</strong> fluctuation of prices of upland crop products grown <strong>in</strong> rotation withrice or through diversification of rice land. Farmers have frequently met with risks anduncerta<strong>in</strong>ty <strong>in</strong> prices. In <strong>the</strong> Mekong Delta non-rice food crops only contributed 10 percentto food production.2.2 Economic Scenario of <strong>the</strong> Agricultural Sector<strong>Crop</strong>s, fishery and forestry contributed to <strong>the</strong> national GDP <strong>in</strong> 1990 to <strong>the</strong> tune of40.7 percent, which decreased to 23.5 percent <strong>in</strong> 1998, although <strong>the</strong> net value <strong>in</strong>creased by abig marg<strong>in</strong>.In terms of value structure, agriculture shared above 80 percent of <strong>the</strong> total valuefrom agriculture, fisheries and forestry (1995-1998). In <strong>the</strong> rural economy, agricultural* Professor and Senior Scientist, Cuulong Delta Rice Research Institute, Omon, Cantho, Vietnam.147
production accounted for around 80 percent with animal husbandry (17 percent) and services(3 percent) mak<strong>in</strong>g up <strong>the</strong> rema<strong>in</strong>der. The country is try<strong>in</strong>g to <strong>in</strong>crease <strong>the</strong> proportion of <strong>the</strong>value structure from animal husbandry and services through <strong>in</strong>dustrialization andmodernization.With regard to trade of agricultural products, rice, rubber, coffee, tea, cashew nut,peanut, black pepper and o<strong>the</strong>r horticultural commodities are exported. Agriculturalproducts imported are cotton, edible oil, milk and tobacco. Major crops for export are shown<strong>in</strong> Table 2. In 1999, 4.5 million tonnes of milled rice were exported from Viet Nam, whichbecame <strong>the</strong> second largest rice exporter, after Thailand.Table 1. Cultivated Area, Yield and Production of <strong>the</strong> Major <strong>Crop</strong>s<strong>Crop</strong>Paddy riceCornSweet potatoCassavaVegetablesBeansCottonJute, kanefRushSugar canePeanutSoybeanTobaccoCoffeeTeaRubberCoconutCash cropsFruit cropsArea(1000 ha)7,362.4649.7254.9231.6401.4221.520.28.711.0283.0269.4127.831.2370,60279,180389,778142,504196,003438.4Production(1000 tonnes)29,141.71,612.01,517.31,783.45,150.0144.120.718.667.013,843.5386.0141.331.7409.3229,540199,733105,45053,251-Yield(qu<strong>in</strong>tal/ha)39.624.859.577.0128.36.510.221.360.9489.214.311.110.2------Source: Statistical Publish<strong>in</strong>g House, Hanoi, 1999.Table 2. Ma<strong>in</strong> <strong>Crop</strong>s for Export (thousand tonnes)<strong>Crop</strong> 1990 1995 1996 1997 1998Milled RiceTeaCoffeeRubberPeanutCashew nutBlack pepper1.62416.189.675.970.724.79.01.99818.8248.1138.1111.099.017.93.00320.8283.7194.5127.016.525.33.55332.2389.3194.583.033.323.03.80034.0379.0185.087.030.023.0Source: Statistical Publish<strong>in</strong>g House, Hanoi, 1999.148
- Page 2 and 3:
RAP PUBLICATION: 2001/03CROP DIVERS
- Page 4 and 5:
CROP DIVERSIFICATION IN THEASIA-PAC
- Page 6 and 7:
13. INTENSIFICATION OF CROP DIVERSI
- Page 8 and 9:
INTRODUCTORY REMARKSMinas K. Papade
- Page 10 and 11:
New opportunities that would benefi
- Page 12 and 13:
CROP DIVERSIFICATION IN BANGLADESHM
- Page 14 and 15:
(CDP) during 1990/95 in 125 Thanas
- Page 16 and 17:
SlName of Crops1 Aus:HYVLocalTable
- Page 18 and 19:
Table 4. Trade of Crops/products (I
- Page 20 and 21:
through development projects implem
- Page 22 and 23:
y the terminal year of the Fifth Pl
- Page 24 and 25:
cropping. This has only been possib
- Page 26 and 27:
process and export those labour int
- Page 28 and 29:
g) restoration/improvement of soil
- Page 30 and 31:
8. RECOMMENDATIONSConsidering the i
- Page 32 and 33:
enthusiasm of the farmers in their
- Page 34 and 35:
3.3 The Formation and Development o
- Page 36 and 37:
carried out for years, guarantees t
- Page 38 and 39:
environment protection. Special att
- Page 40 and 41:
2. CROP PRODUCTION AND ECONOMICS SC
- Page 42 and 43:
What is most notable is the change
- Page 44 and 45:
8.36 m/ha involved in the area shif
- Page 46 and 47:
fact that the area shares of the do
- Page 48 and 49:
country. Therefore, a judicious use
- Page 50 and 51:
5.3 Emerging Technology and Crop Di
- Page 52 and 53:
7. CONCLUSIONSIndia, being a vast c
- Page 54 and 55:
Table 3. All India: Temporal Change
- Page 56 and 57:
Table 5. All India: Temporal Change
- Page 58 and 59:
CROP DIVERSIFICATION IN JAPANMasa I
- Page 60 and 61:
production, these ratios were deter
- Page 62 and 63:
soybean using paddy fields should c
- Page 64 and 65:
food industry have sharply increase
- Page 66 and 67:
7. CONCLUSIONSThe Japanese socio-ec
- Page 68 and 69:
Figure 2. Change of Rice Productivi
- Page 70 and 71:
Figure 4. Aid Provided by Major Cou
- Page 72 and 73:
The Natural Rubber (NR) industry co
- Page 74 and 75:
About 78 percent of the rubber grow
- Page 76 and 77:
should be attractive to justify the
- Page 78 and 79:
REFERENCESAnon. 1990. Proceedings o
- Page 80 and 81:
Table 3. Agriculture Land Use in Sa
- Page 82 and 83:
Table 7. Paddy Production, 1985-199
- Page 84 and 85:
Table 10. Imports and Exports of Fr
- Page 86 and 87:
Table 14. Exports and Imports of Pr
- Page 88 and 89:
CROP DIVERSIFICATION IN NEPALK. C.
- Page 90 and 91:
We know hill farmers face many prob
- Page 92 and 93:
Table 2. Growth of Agricultural Com
- Page 94 and 95:
3. PATTERN OF CROP DIVERSIFICATIONN
- Page 96 and 97:
With regard to success stories of c
- Page 98 and 99:
5. CHALLENGES, OPPORTUNITIES AND PR
- Page 100 and 101:
It recognizes the need for a differ
- Page 102 and 103:
CROP DIVERSIFICATION IN THE PHILIPP
- Page 104 and 105: 2.3 Yield Per Hectare of Agricultur
- Page 106 and 107: In coconut, diversification means t
- Page 108 and 109: were used in the preparation of the
- Page 110 and 111: There are a variety of factors that
- Page 112 and 113: Table 1. Production Area of Commerc
- Page 114 and 115: Table 3. Yield (tonnes) Per Hectare
- Page 116 and 117: Table 5. Selected Macroeconomic and
- Page 118 and 119: Table 7. Dominant Rice Cropping Pat
- Page 120 and 121: 1.2 Soils in the Crop Diversificati
- Page 122 and 123: Table 1. Major Crops, Their Extents
- Page 124 and 125: drained and rice on poorly drained
- Page 126 and 127: Figure 3. Schematic Representation
- Page 128 and 129: The potato production in the up cou
- Page 130 and 131: Table 6 clearly shows that there is
- Page 132 and 133: In addition to the above scenario,
- Page 134 and 135: 6. GOVERNMENT POLICIES AND STRATEGI
- Page 136 and 137: Panabokke, C.R. 1996. Soils and agr
- Page 138 and 139: y promoting diversified crops inste
- Page 140 and 141: Over the past few years, agricultur
- Page 142 and 143: Land TenureMore than half of the Th
- Page 144 and 145: The New theory is a novel approach
- Page 146 and 147: Mushrooms: nang-fah mushroom (Pleur
- Page 148 and 149: - Farmers can sell their rice at a
- Page 150 and 151: In order to maintain the growth rat
- Page 152 and 153: REFERENCESAthipanan, Withaya. 1995.
- Page 156 and 157: 3. PATTERNS OF CROP DIVERSIFICATION
- Page 158 and 159: the contour with mulching using ric
- Page 160 and 161: development of new crop varieties a
- Page 162 and 163: • Cultivated and growing area und
- Page 164 and 165: other hand, the size of an average
- Page 166 and 167: 4.1 Crop NutritionA major contribut
- Page 168 and 169: increased from 130 million ha to 15
- Page 170 and 171: in tobacco nurseries. These also he
- Page 172 and 173: past experience. A sustainable prog
- Page 174 and 175: diversification, taking into accoun
- Page 176 and 177: The major outputs are:- Integration
- Page 178 and 179: • Database and information materi
- Page 180 and 181: • Business plans have been formul
- Page 182 and 183: minimize such losses. The developme
- Page 184 and 185: LIST OF PARTICIPANTSBANGLADESHM. En
- Page 186 and 187: SRI LANKAH.P.M. GunasenaDirectorPos
- Page 188 and 189: FAOR.B. SinghAssistant Director-Gen