Biofuel co-products as livestock feed - Opportunities and challenges
Biofuel co-products as livestock feed - Opportunities and challenges
Biofuel co-products as livestock feed - Opportunities and challenges
- No tags were found...

You also want an ePaper? Increase the reach of your titles
YUMPU automatically turns print PDFs into web optimized ePapers that Google loves.
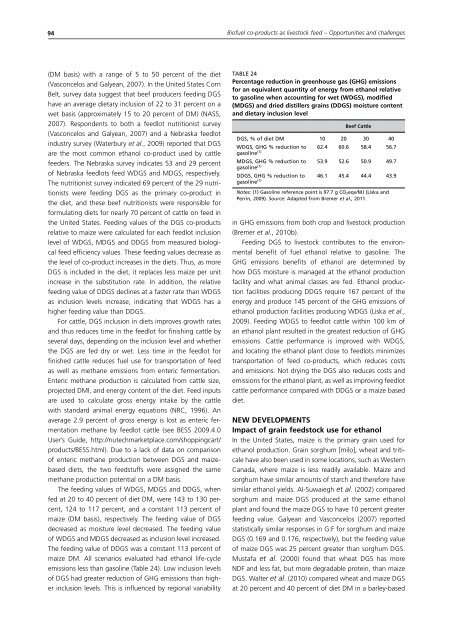
94<strong>Biofuel</strong> <strong>co</strong>-<strong>products</strong> <strong>as</strong> <strong>livestock</strong> <strong>feed</strong> – <strong>Opportunities</strong> <strong>and</strong> <strong>challenges</strong>(DM b<strong>as</strong>is) with a range of 5 to 50 percent of the diet(V<strong>as</strong><strong>co</strong>ncelos <strong>and</strong> Galyean, 2007). In the United States CornBelt, survey data suggest that beef producers <strong>feed</strong>ing DGShave an average dietary inclusion of 22 to 31 percent on awet b<strong>as</strong>is (approximately 15 to 20 percent of DM) (NASS,2007). Respondents to both a <strong>feed</strong>lot nutritionist survey(V<strong>as</strong><strong>co</strong>ncelos <strong>and</strong> Galyean, 2007) <strong>and</strong> a Nebr<strong>as</strong>ka <strong>feed</strong>lotindustry survey (Waterbury et al., 2009) reported that DGSare the most <strong>co</strong>mmon ethanol <strong>co</strong>-product used by cattle<strong>feed</strong>ers. The Nebr<strong>as</strong>ka survey indicates 53 <strong>and</strong> 29 percentof Nebr<strong>as</strong>ka <strong>feed</strong>lots <strong>feed</strong> WDGS <strong>and</strong> MDGS, respectively.The nutritionist survey indicated 69 percent of the 29 nutritionistswere <strong>feed</strong>ing DGS <strong>as</strong> the primary <strong>co</strong>-product inthe diet, <strong>and</strong> these beef nutritionists were responsible forformulating diets for nearly 70 percent of cattle on <strong>feed</strong> inthe United States. Feeding values of the DGS <strong>co</strong>-<strong>products</strong>relative to maize were calculated for each <strong>feed</strong>lot inclusionlevel of WDGS, MDGS <strong>and</strong> DDGS from me<strong>as</strong>ured biological<strong>feed</strong> efficiency values. These <strong>feed</strong>ing values decre<strong>as</strong>e <strong>as</strong>the level of <strong>co</strong>-product incre<strong>as</strong>es in the diets. Thus, <strong>as</strong> moreDGS is included in the diet, it replaces less maize per unitincre<strong>as</strong>e in the substitution rate. In addition, the relative<strong>feed</strong>ing value of DDGS declines at a f<strong>as</strong>ter rate than WDGS<strong>as</strong> inclusion levels incre<strong>as</strong>e, indicating that WDGS h<strong>as</strong> ahigher <strong>feed</strong>ing value than DDGS.For cattle, DGS inclusion in diets improves growth rates<strong>and</strong> thus reduces time in the <strong>feed</strong>lot for finishing cattle byseveral days, depending on the inclusion level <strong>and</strong> whetherthe DGS are fed dry or wet. Less time in the <strong>feed</strong>lot forfinished cattle reduces fuel use for transportation of <strong>feed</strong><strong>as</strong> well <strong>as</strong> methane emissions from enteric fermentation.Enteric methane production is calculated from cattle size,projected DMI, <strong>and</strong> energy <strong>co</strong>ntent of the diet. Feed inputsare used to calculate gross energy intake by the cattlewith st<strong>and</strong>ard animal energy equations (NRC, 1996). Anaverage 2.9 percent of gross energy is lost <strong>as</strong> enteric fermentationmethane by <strong>feed</strong>lot cattle (see BESS 2009.4.0User’s Guide, http://nutechmarketplace.<strong>co</strong>m/shoppingcart/<strong>products</strong>/BESS.html). Due to a lack of data on <strong>co</strong>mparisonof enteric methane production between DGS <strong>and</strong> maizeb<strong>as</strong>eddiets, the two <strong>feed</strong>stuffs were <strong>as</strong>signed the samemethane production potential on a DM b<strong>as</strong>is.The <strong>feed</strong>ing values of WDGS, MDGS <strong>and</strong> DDGS, whenfed at 20 to 40 percent of diet DM, were 143 to 130 percent,124 to 117 percent, <strong>and</strong> a <strong>co</strong>nstant 113 percent ofmaize (DM b<strong>as</strong>is), respectively. The <strong>feed</strong>ing value of DGSdecre<strong>as</strong>ed <strong>as</strong> moisture level decre<strong>as</strong>ed. The <strong>feed</strong>ing valueof WDGS <strong>and</strong> MDGS decre<strong>as</strong>ed <strong>as</strong> inclusion level incre<strong>as</strong>ed.The <strong>feed</strong>ing value of DDGS w<strong>as</strong> a <strong>co</strong>nstant 113 percent ofmaize DM. All scenarios evaluated had ethanol life-cycleemissions less than g<strong>as</strong>oline (Table 24). Low inclusion levelsof DGS had greater reduction of GHG emissions than higherinclusion levels. This is influenced by regional variabilityTABLE 24Percentage reduction in greenhouse g<strong>as</strong> (GHG) emissionsfor an equivalent quantity of energy from ethanol relativeto g<strong>as</strong>oline when ac<strong>co</strong>unting for wet (WDGS), modified(MDGS) <strong>and</strong> dried distillers grains (DDGS) moisture <strong>co</strong>ntent<strong>and</strong> dietary inclusion levelBeef CattleDGS, % of diet DM 10 20 30 40WDGS, GHG % reduction to 62.4 60.6 58.4 56.7g<strong>as</strong>oline (1)MDGS, GHG % reduction to 53.9 52.6 50.9 49.7g<strong>as</strong>oline (1)DDGS, GHG % reduction tog<strong>as</strong>oline (1) 46.1 45.4 44.4 43.9Notes: (1) G<strong>as</strong>oline reference point is 97.7 g CO 2eqv/MJ (Liska <strong>and</strong>Perrin, 2009). Source: Adapted from Bremer et al., 2011.in GHG emissions from both crop <strong>and</strong> <strong>livestock</strong> production(Bremer et al., 2010b).Feeding DGS to <strong>livestock</strong> <strong>co</strong>ntributes to the environmentalbenefit of fuel ethanol relative to g<strong>as</strong>oline. TheGHG emissions benefits of ethanol are determined byhow DGS moisture is managed at the ethanol productionfacility <strong>and</strong> what animal cl<strong>as</strong>ses are fed. Ethanol productionfacilities producing DDGS require 167 percent of theenergy <strong>and</strong> produce 145 percent of the GHG emissions ofethanol production facilities producing WDGS (Liska et al.,2009). Feeding WDGS to <strong>feed</strong>lot cattle within 100 km ofan ethanol plant resulted in the greatest reduction of GHGemissions. Cattle performance is improved with WDGS,<strong>and</strong> locating the ethanol plant close to <strong>feed</strong>lots minimizestransportation of <strong>feed</strong> <strong>co</strong>-<strong>products</strong>, which reduces <strong>co</strong>sts<strong>and</strong> emissions. Not drying the DGS also reduces <strong>co</strong>sts <strong>and</strong>emissions for the ethanol plant, <strong>as</strong> well <strong>as</strong> improving <strong>feed</strong>lotcattle performance <strong>co</strong>mpared with DDGS or a maize b<strong>as</strong>eddiet.NEW DEVELOPMENTSImpact of grain <strong>feed</strong>stock use for ethanolIn the United States, maize is the primary grain used forethanol production. Grain sorghum [milo], wheat <strong>and</strong> triticalehave also been used in some locations, such <strong>as</strong> WesternCanada, where maize is less readily available. Maize <strong>and</strong>sorghum have similar amounts of starch <strong>and</strong> therefore havesimilar ethanol yields. Al-Suwaiegh et al. (2002) <strong>co</strong>mparedsorghum <strong>and</strong> maize DGS produced at the same ethanolplant <strong>and</strong> found the maize DGS to have 10 percent greater<strong>feed</strong>ing value. Galyean <strong>and</strong> V<strong>as</strong><strong>co</strong>ncelos (2007) reportedstatistically similar responses in G:F for sorghum <strong>and</strong> maizeDGS (0.169 <strong>and</strong> 0.176, respectively), but the <strong>feed</strong>ing valueof maize DGS w<strong>as</strong> 25 percent greater than sorghum DGS.Mustafa et al. (2000) found that wheat DGS h<strong>as</strong> moreNDF <strong>and</strong> less fat, but more degradable protein, than maizeDGS. Walter et al. (2010) <strong>co</strong>mpared wheat <strong>and</strong> maize DGSat 20 percent <strong>and</strong> 40 percent of diet DM in a barley-b<strong>as</strong>ed