Biofuel co-products as livestock feed - Opportunities and challenges
Biofuel co-products as livestock feed - Opportunities and challenges
Biofuel co-products as livestock feed - Opportunities and challenges
- No tags were found...

You also want an ePaper? Increase the reach of your titles
YUMPU automatically turns print PDFs into web optimized ePapers that Google loves.
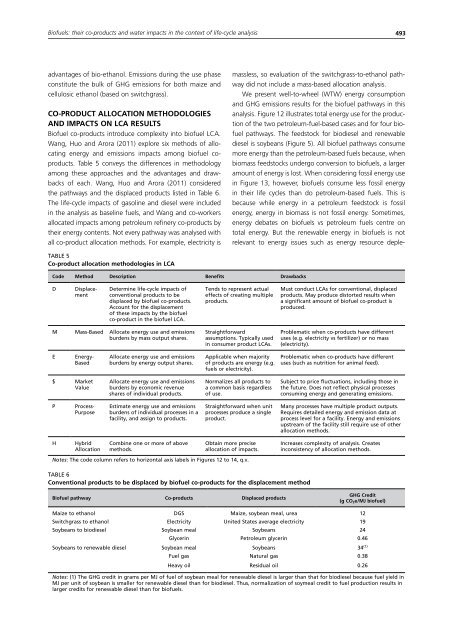
<strong>Biofuel</strong>s: their <strong>co</strong>-<strong>products</strong> <strong>and</strong> water impacts in the <strong>co</strong>ntext of life-cycle analysis 493advantages of bio-ethanol. Emissions during the use ph<strong>as</strong>e<strong>co</strong>nstitute the bulk of GHG emissions for both maize <strong>and</strong>cellulosic ethanol (b<strong>as</strong>ed on switchgr<strong>as</strong>s).CO-PRODUCT ALLOCATION METHODOLOGIESAND IMPACTS ON LCA RESULTS<strong>Biofuel</strong> <strong>co</strong>-<strong>products</strong> introduce <strong>co</strong>mplexity into biofuel LCA.Wang, Huo <strong>and</strong> Arora (2011) explore six methods of allocatingenergy <strong>and</strong> emissions impacts among biofuel <strong>co</strong><strong>products</strong>.Table 5 <strong>co</strong>nveys the differences in methodologyamong these approaches <strong>and</strong> the advantages <strong>and</strong> drawbacksof each. Wang, Huo <strong>and</strong> Arora (2011) <strong>co</strong>nsideredthe pathways <strong>and</strong> the displaced <strong>products</strong> listed in Table 6.The life-cycle impacts of g<strong>as</strong>oline <strong>and</strong> diesel were includedin the analysis <strong>as</strong> b<strong>as</strong>eline fuels, <strong>and</strong> Wang <strong>and</strong> <strong>co</strong>-workersallocated impacts among petroleum refinery <strong>co</strong>-<strong>products</strong> bytheir energy <strong>co</strong>ntents. Not every pathway w<strong>as</strong> analysed withall <strong>co</strong>-product allocation methods. For example, electricity ism<strong>as</strong>sless, so evaluation of the switchgr<strong>as</strong>s-to-ethanol pathwaydid not include a m<strong>as</strong>s-b<strong>as</strong>ed allocation analysis.We present well-to-wheel (WTW) energy <strong>co</strong>nsumption<strong>and</strong> GHG emissions results for the biofuel pathways in thisanalysis. Figure 12 illustrates total energy use for the productionof the two petroleum-fuel-b<strong>as</strong>ed c<strong>as</strong>es <strong>and</strong> for four biofuelpathways. The <strong>feed</strong>stock for biodiesel <strong>and</strong> renewablediesel is soybeans (Figure 5). All biofuel pathways <strong>co</strong>nsumemore energy than the petroleum-b<strong>as</strong>ed fuels because, whenbiom<strong>as</strong>s <strong>feed</strong>stocks undergo <strong>co</strong>nversion to biofuels, a largeramount of energy is lost. When <strong>co</strong>nsidering fossil energy usein Figure 13, however, biofuels <strong>co</strong>nsume less fossil energyin their life cycles than do petroleum-b<strong>as</strong>ed fuels. This isbecause while energy in a petroleum <strong>feed</strong>stock is fossilenergy, energy in biom<strong>as</strong>s is not fossil energy. Sometimes,energy debates on biofuels vs petroleum fuels centre ontotal energy. But the renewable energy in biofuels is notrelevant to energy issues such <strong>as</strong> energy resource deple-TABLE 5Co-product allocation methodologies in LCACode Method Description Benefits DrawbacksDDisplacementDetermine life-cycle impacts of<strong>co</strong>nventional <strong>products</strong> to bedisplaced by biofuel <strong>co</strong>-<strong>products</strong>.Ac<strong>co</strong>unt for the displacementof these impacts by the biofuel<strong>co</strong>-product in the biofuel LCA.Tends to represent actualeffects of creating multiple<strong>products</strong>.Must <strong>co</strong>nduct LCAs for <strong>co</strong>nventional, displaced<strong>products</strong>. May produce distorted results whena significant amount of biofuel <strong>co</strong>-product isproduced.M M<strong>as</strong>s-B<strong>as</strong>ed Allocate energy use <strong>and</strong> emissionsburdens by m<strong>as</strong>s output shares.Straightforward<strong>as</strong>sumptions. Typically usedin <strong>co</strong>nsumer product LCAs.Problematic when <strong>co</strong>-<strong>products</strong> have differentuses (e.g. electricity vs fertilizer) or no m<strong>as</strong>s(electricity).EEnergy-B<strong>as</strong>edAllocate energy use <strong>and</strong> emissionsburdens by energy output shares.Applicable when majorityof <strong>products</strong> are energy (e.g.fuels or electricity).Problematic when <strong>co</strong>-<strong>products</strong> have differentuses (such <strong>as</strong> nutrition for animal <strong>feed</strong>).$ MarketValueAllocate energy use <strong>and</strong> emissionsburdens by e<strong>co</strong>nomic revenueshares of individual <strong>products</strong>.Normalizes all <strong>products</strong> toa <strong>co</strong>mmon b<strong>as</strong>is regardlessof use.Subject to price fluctuations, including those inthe future. Does not reflect physical processes<strong>co</strong>nsuming energy <strong>and</strong> generating emissions.PProcess-PurposeEstimate energy use <strong>and</strong> emissionsburdens of individual processes in afacility, <strong>and</strong> <strong>as</strong>sign to <strong>products</strong>.Straightforward when unitprocesses produce a singleproduct.Many processes have multiple product outputs.Requires detailed energy <strong>and</strong> emission data atprocess level for a facility. Energy <strong>and</strong> emissionsupstream of the facility still require use of otherallocation methods.HHybridAllocationCombine one or more of abovemethods.Obtain more preciseallocation of impacts.Notes: The <strong>co</strong>de <strong>co</strong>lumn refers to horizontal axis labels in Figures 12 to 14, q.v.Incre<strong>as</strong>es <strong>co</strong>mplexity of analysis. Createsin<strong>co</strong>nsistency of allocation methods.TABLE 6Conventional <strong>products</strong> to be displaced by biofuel <strong>co</strong>-<strong>products</strong> for the displacement method<strong>Biofuel</strong> pathway Co-<strong>products</strong> Displaced <strong>products</strong>GHG Credit(g CO 2e/MJ biofuel)Maize to ethanol DGS Maize, soybean meal, urea 12Switchgr<strong>as</strong>s to ethanol Electricity United States average electricity 19Soybeans to biodiesel Soybean meal Soybeans 24Glycerin Petroleum glycerin 0.46Soybeans to renewable diesel Soybean meal Soybeans 34 (1)Fuel g<strong>as</strong> Natural g<strong>as</strong> 0.38Heavy oil Residual oil 0.26Notes: (1) The GHG credit in grams per MJ of fuel of soybean meal for renewable diesel is larger than that for biodiesel because fuel yield inMJ per unit of soybean is smaller for renewable diesel than for biodiesel. Thus, normalization of soymeal credit to fuel production results inlarger credits for renewable diesel than for biofuels.