Biofuel co-products as livestock feed - Opportunities and challenges
Biofuel co-products as livestock feed - Opportunities and challenges
Biofuel co-products as livestock feed - Opportunities and challenges
- No tags were found...

You also want an ePaper? Increase the reach of your titles
YUMPU automatically turns print PDFs into web optimized ePapers that Google loves.
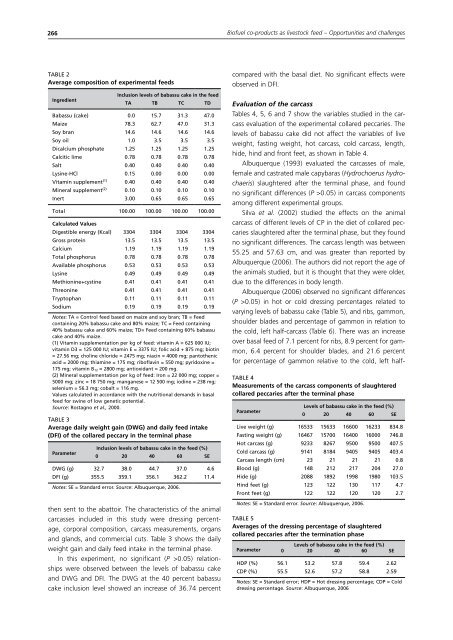
266<strong>Biofuel</strong> <strong>co</strong>-<strong>products</strong> <strong>as</strong> <strong>livestock</strong> <strong>feed</strong> – <strong>Opportunities</strong> <strong>and</strong> <strong>challenges</strong>TABLE 2Average <strong>co</strong>mposition of experimental <strong>feed</strong>sIngredientInclusion levels of bab<strong>as</strong>su cake in the <strong>feed</strong>TA TB TC TDBab<strong>as</strong>su (cake) 0.0 15.7 31.3 47.0Maize 78.3 62.7 47.0 31.3Soy bran 14.6 14.6 14.6 14.6Soy oil 1.0 3.5 3.5 3.5Dicalcium phosphate 1.25 1.25 1.25 1.25Calcitic lime 0.78 0.78 0.78 0.78Salt 0.40 0.40 0.40 0.40Lysine-HCl 0.15 0.00 0.00 0.00Vitamin supplement (1) 0.40 0.40 0.40 0.40Mineral supplement (2) 0.10 0.10 0.10 0.10Inert 3.00 0.65 0.65 0.65Total 100.00 100.00 100.00 100.00Calculated ValuesDigestible energy (Kcal) 3304 3304 3304 3304Gross protein 13.5 13.5 13.5 13.5Calcium 1.19 1.19 1.19 1.19Total phosphorus 0.78 0.78 0.78 0.78Available phosphorus 0.53 0.53 0.53 0.53Lysine 0.49 0.49 0.49 0.49Methionine+cystine 0.41 0.41 0.41 0.41Threonine 0.41 0.41 0.41 0.41Tryptophan 0.11 0.11 0.11 0.11Sodium 0.19 0.19 0.19 0.19Notes: TA = Control <strong>feed</strong> b<strong>as</strong>ed on maize <strong>and</strong> soy bran; TB = Feed<strong>co</strong>ntaining 20% bab<strong>as</strong>su cake <strong>and</strong> 80% maize; TC = Feed <strong>co</strong>ntaining40% bab<strong>as</strong>su cake <strong>and</strong> 60% maize; TD= Feed <strong>co</strong>ntaining 60% bab<strong>as</strong>sucake <strong>and</strong> 40% maize.(1) Vitamin supplementation per kg of <strong>feed</strong>: vitamin A = 625 000 IU;vitamin D3 = 125 000 IU; vitamin E = 3375 IU; folic acid + 875 mg; biotin= 27.56 mg; choline chloride = 2475 mg; niacin = 4000 mg; pantothenicacid = 2000 mg; thiamine = 175 mg; riboflavin = 550 mg; pyridoxine =175 mg; vitamin B 12 = 2800 mg; antioxidant = 200 mg.(2) Mineral supplementation per kg of <strong>feed</strong>: Iron = 22 000 mg; <strong>co</strong>pper =5000 mg; zinc = 18 750 mg; manganese = 12 500 mg; iodine = 238 mg;selenium = 56.3 mg; <strong>co</strong>balt = 116 mg.Values calculated in ac<strong>co</strong>rdance with the nutritional dem<strong>and</strong>s in b<strong>as</strong>al<strong>feed</strong> for swine of low genetic potential.Source: Rostagno et al., 2000.TABLE 3Average daily weight gain (DWG) <strong>and</strong> daily <strong>feed</strong> intake(DFI) of the <strong>co</strong>llared peccary in the terminal ph<strong>as</strong>eParameterInclusion levels of bab<strong>as</strong>su cake in the <strong>feed</strong> (%)0 20 40 60 SEDWG (g) 32.7 38.0 44.7 37.0 4.6DFI (g) 355.5 359.1 356.1 362.2 11.4Notes: SE = St<strong>and</strong>ard error. Source: Albuquerque, 2006.then sent to the abattoir. The characteristics of the animalcarc<strong>as</strong>ses included in this study were dressing percentage,<strong>co</strong>rporal <strong>co</strong>mposition, carc<strong>as</strong>s me<strong>as</strong>urements, organs<strong>and</strong> gl<strong>and</strong>s, <strong>and</strong> <strong>co</strong>mmercial cuts. Table 3 shows the dailyweight gain <strong>and</strong> daily <strong>feed</strong> intake in the terminal ph<strong>as</strong>e.In this experiment, no significant (P >0.05) relationshipswere observed between the levels of bab<strong>as</strong>su cake<strong>and</strong> DWG <strong>and</strong> DFI. The DWG at the 40 percent bab<strong>as</strong>sucake inclusion level showed an incre<strong>as</strong>e of 36.74 percent<strong>co</strong>mpared with the b<strong>as</strong>al diet. No significant effects wereobserved in DFI.Evaluation of the carc<strong>as</strong>sTables 4, 5, 6 <strong>and</strong> 7 show the variables studied in the carc<strong>as</strong>sevaluation of the experimental <strong>co</strong>llared peccaries. Thelevels of bab<strong>as</strong>su cake did not affect the variables of liveweight, f<strong>as</strong>ting weight, hot carc<strong>as</strong>s, <strong>co</strong>ld carc<strong>as</strong>s, length,hide, hind <strong>and</strong> front feet, <strong>as</strong> shown in Table 4.Albuquerque (1993) evaluated the carc<strong>as</strong>ses of male,female <strong>and</strong> c<strong>as</strong>trated male capybar<strong>as</strong> (Hydrochoerus hydrochaeris)slaughtered after the terminal ph<strong>as</strong>e, <strong>and</strong> foundno significant differences (P >0.05) in carc<strong>as</strong>s <strong>co</strong>mponentsamong different experimental groups.Silva et al. (2002) studied the effects on the animalcarc<strong>as</strong>s of different levels of CP in the diet of <strong>co</strong>llared peccariesslaughtered after the terminal ph<strong>as</strong>e, but they foundno significant differences. The carc<strong>as</strong>s length w<strong>as</strong> between55.25 <strong>and</strong> 57.63 cm, <strong>and</strong> w<strong>as</strong> greater than reported byAlbuquerque (2006). The authors did not report the age ofthe animals studied, but it is thought that they were older,due to the differences in body length.Albuquerque (2006) observed no significant differences(P >0.05) in hot or <strong>co</strong>ld dressing percentages related tovarying levels of bab<strong>as</strong>su cake (Table 5), <strong>and</strong> ribs, gammon,shoulder blades <strong>and</strong> percentage of gammon in relation tothe <strong>co</strong>ld, left half-carc<strong>as</strong>s (Table 6). There w<strong>as</strong> an incre<strong>as</strong>eover b<strong>as</strong>al <strong>feed</strong> of 7.1 percent for ribs, 8.9 percent for gammon,6.4 percent for shoulder blades, <strong>and</strong> 21.6 percentfor percentage of gammon relative to the <strong>co</strong>ld, left half-TABLE 4Me<strong>as</strong>urements of the carc<strong>as</strong>s <strong>co</strong>mponents of slaughtered<strong>co</strong>llared peccaries after the terminal ph<strong>as</strong>eParameterLevels of bab<strong>as</strong>su cake in the <strong>feed</strong> (%)0 20 40 60 SELive weight (g) 16533 15633 16600 16233 834.8F<strong>as</strong>ting weight (g) 16467 15700 16400 16000 746.8Hot carc<strong>as</strong>s (g) 9233 8267 9500 9500 407.5Cold carc<strong>as</strong>s (g) 9141 8184 9405 9405 403.4Carc<strong>as</strong>s length (cm) 23 21 21 21 0.8Blood (g) 148 212 217 204 27.0Hide (g) 2088 1892 1998 1980 103.5Hind feet (g) 123 122 130 117 4.7Front feet (g) 122 122 120 120 2.7Notes: SE = St<strong>and</strong>ard error. Source: Albuquerque, 2006.TABLE 5Averages of the dressing percentage of slaughtered<strong>co</strong>llared peccaries after the termination ph<strong>as</strong>eParameterLevels of bab<strong>as</strong>su cake in the <strong>feed</strong> (%)0 20 40 60 SEHDP (%) 56.1 53.2 57.8 59.4 2.62CDP (%) 55.5 52.6 57.2 58.8 2.59Notes: SE = St<strong>and</strong>ard error; HDP = Hot dressing percentage; CDP = Colddressing percentage. Source: Albuquerque, 2006