Biofuel co-products as livestock feed - Opportunities and challenges
Biofuel co-products as livestock feed - Opportunities and challenges
Biofuel co-products as livestock feed - Opportunities and challenges
- No tags were found...

Create successful ePaper yourself
Turn your PDF publications into a flip-book with our unique Google optimized e-Paper software.
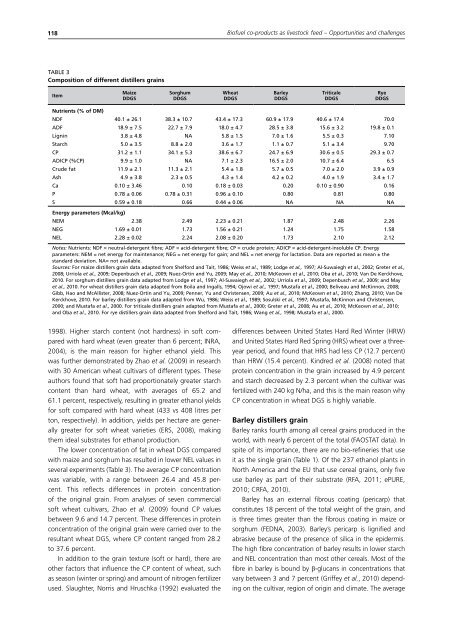
118<strong>Biofuel</strong> <strong>co</strong>-<strong>products</strong> <strong>as</strong> <strong>livestock</strong> <strong>feed</strong> – <strong>Opportunities</strong> <strong>and</strong> <strong>challenges</strong>TABLE 3Composition of different distillers grainsItemMaizeDDGSSorghumDDGSWheatDDGSBarleyDDGSTriticaleDDGSRyeDDGSNutrients (% of DM)NDF 40.1 ± 26.1 38.3 ± 10.7 43.4 ± 17.3 60.9 ± 17.9 40.6 ± 17.4 70.0ADF 18.9 ± 7.5 22.7 ± 7.9 18.0 ± 4.7 28.5 ± 3.8 15.6 ± 3.2 19.8 ± 0.1Lignin 3.8 ± 4.8 NA 5.8 ± 1.5 7.0 ± 1.6 5.5 ± 0.3 7.10Starch 5.0 ± 3.5 8.8 ± 2.0 3.6 ± 1.7 1.1 ± 0.7 5.1 ± 3.4 9.70CP 31.2 ± 1.1 34.1 ± 5.3 38.6 ± 6.7 24.7 ± 6.9 30.6 ± 0.5 29.3 ± 0.7ADICP (%CP) 9.9 ± 1.0 NA 7.1 ± 2.3 16.5 ± 2.0 10.7 ± 6.4 6.5Crude fat 11.9 ± 2.1 11.3 ± 2.1 5.4 ± 1.8 5.7 ± 0.5 7.0 ± 2.0 3.9 ± 0.9Ash 4.9 ± 3.8 2.3 ± 0.5 4.3 ± 1.4 4.2 ± 0.2 4.0 ± 1.9 3.4 ± 1.7Ca 0.10 ± 3.46 0.10 0.18 ± 0.03 0.20 0.10 ± 0.90 0.16P 0.78 ± 0.06 0.78 ± 0.31 0.96 ± 0.10 0.80 0.81 0.80S 0.59 ± 0.18 0.66 0.44 ± 0.06 NA NA NAEnergy parameters (Mcal/kg)NEM 2.38 2.49 2.23 ± 0.21 1.87 2.48 2.26NEG 1.69 ± 0.01 1.73 1.56 ± 0.21 1.24 1.75 1.58NEL 2.28 ± 0.02 2.24 2.08 ± 0.20 1.73 2.10 2.12Notes: Nutrients: NDF = neutral-detergent fibre; ADF = acid-detergent fibre; CP = crude protein; ADICP = acid-detergent-insoluble CP. Energyparameters: NEM = net energy for maintenance; NEG = net energy for gain; <strong>and</strong> NEL = net energy for lactation. Data are reported <strong>as</strong> mean ± thest<strong>and</strong>ard deviation. NA= not available.Sources: For maize distillers grain data adapted from Shelford <strong>and</strong> Tait, 1986; Weiss et al., 1989; Lodge et al., 1997; Al-Suwaiegh et al., 2002; Greter et al.,2008; Urriola et al., 2009; Depenbusch et al., 2009; Nuez-Ortin <strong>and</strong> Yu, 2009; May et al., 2010; McKeown et al., 2010; Oba et al., 2010; Van De Kerckhove,2010. For sorghum distillers grain data adapted from Lodge et al., 1997; Al-Suwaiegh et al., 2002; Urriola et al., 2009; Depenbusch et al., 2009; <strong>and</strong> Mayet al., 2010. For wheat distillers grain data adapted from Boila <strong>and</strong> Ingalls, 1994; Ojowi et al., 1997; Mustafa et al., 2000; Beliveau <strong>and</strong> McKinnon, 2008;Gibb, Hao <strong>and</strong> McAllister, 2008; Nuez-Ortin <strong>and</strong> Yu, 2009; Penner, Yu <strong>and</strong> Christensen, 2009; Au et al., 2010; McKeown et al., 2010; Zhang, 2010; Van DeKerckhove, 2010. For barley distillers grain data adapted from Wu, 1986; Weiss et al., 1989; Sosulski et al., 1997; Mustafa, McKinnon <strong>and</strong> Christensen,2000; <strong>and</strong> Mustafa et al., 2000. For triticale distillers grain adapted from Mustafa et al., 2000; Greter et al., 2008; Au et al., 2010; McKeown et al., 2010;<strong>and</strong> Oba et al., 2010. For rye distillers grain data adapted from Shelford <strong>and</strong> Tait, 1986; Wang et al., 1998; Mustafa et al., 2000.1998). Higher starch <strong>co</strong>ntent (not hardness) in soft <strong>co</strong>mparedwith hard wheat (even greater than 6 percent; INRA,2004), is the main re<strong>as</strong>on for higher ethanol yield. Thisw<strong>as</strong> further demonstrated by Zhao et al. (2009) in researchwith 30 American wheat cultivars of different types. Theseauthors found that soft had proportionately greater starch<strong>co</strong>ntent than hard wheat, with averages of 65.2 <strong>and</strong>61.1 percent, respectively, resulting in greater ethanol yieldsfor soft <strong>co</strong>mpared with hard wheat (433 vs 408 litres perton, respectively). In addition, yields per hectare are generallygreater for soft wheat varieties (ERS, 2008), makingthem ideal substrates for ethanol production.The lower <strong>co</strong>ncentration of fat in wheat DGS <strong>co</strong>mparedwith maize <strong>and</strong> sorghum h<strong>as</strong> resulted in lower NEL values inseveral experiments (Table 3). The average CP <strong>co</strong>ncentrationw<strong>as</strong> variable, with a range between 26.4 <strong>and</strong> 45.8 percent.This reflects differences in protein <strong>co</strong>ncentrationof the original grain. From analyses of seven <strong>co</strong>mmercialsoft wheat cultivars, Zhao et al. (2009) found CP valuesbetween 9.6 <strong>and</strong> 14.7 percent. These differences in protein<strong>co</strong>ncentration of the original grain were carried over to theresultant wheat DGS, where CP <strong>co</strong>ntent ranged from 28.2to 37.6 percent.In addition to the grain texture (soft or hard), there areother factors that influence the CP <strong>co</strong>ntent of wheat, such<strong>as</strong> se<strong>as</strong>on (winter or spring) <strong>and</strong> amount of nitrogen fertilizerused. Slaughter, Norris <strong>and</strong> Hruschka (1992) evaluated thedifferences between United States Hard Red Winter (HRW)<strong>and</strong> United States Hard Red Spring (HRS) wheat over a threeyearperiod, <strong>and</strong> found that HRS had less CP (12.7 percent)than HRW (15.4 percent). Kindred et al. (2008) noted thatprotein <strong>co</strong>ncentration in the grain incre<strong>as</strong>ed by 4.9 percent<strong>and</strong> starch decre<strong>as</strong>ed by 2.3 percent when the cultivar w<strong>as</strong>fertilized with 240 kg N/ha, <strong>and</strong> this is the main re<strong>as</strong>on whyCP <strong>co</strong>ncentration in wheat DGS is highly variable.Barley distillers grainBarley ranks fourth among all cereal grains produced in theworld, with nearly 6 percent of the total (FAOSTAT data). Inspite of its importance, there are no bio-refineries that useit <strong>as</strong> the single grain (Table 1). Of the 237 ethanol plants inNorth America <strong>and</strong> the EU that use cereal grains, only fiveuse barley <strong>as</strong> part of their substrate (RFA, 2011; ePURE,2010; CRFA, 2010).Barley h<strong>as</strong> an external fibrous <strong>co</strong>ating (pericarp) that<strong>co</strong>nstitutes 18 percent of the total weight of the grain, <strong>and</strong>is three times greater than the fibrous <strong>co</strong>ating in maize orsorghum (FEDNA, 2003). Barley’s pericarp is lignified <strong>and</strong>abr<strong>as</strong>ive because of the presence of silica in the epidermis.The high fibre <strong>co</strong>ncentration of barley results in lower starch<strong>and</strong> NEL <strong>co</strong>ncentration than most other cereals. Most of thefibre in barley is bound by β-glucans in <strong>co</strong>ncentrations thatvary between 3 <strong>and</strong> 7 percent (Griffey et al., 2010) dependingon the cultivar, region of origin <strong>and</strong> climate. The average