Biofuel co-products as livestock feed - Opportunities and challenges
Biofuel co-products as livestock feed - Opportunities and challenges
Biofuel co-products as livestock feed - Opportunities and challenges
- No tags were found...

Create successful ePaper yourself
Turn your PDF publications into a flip-book with our unique Google optimized e-Paper software.
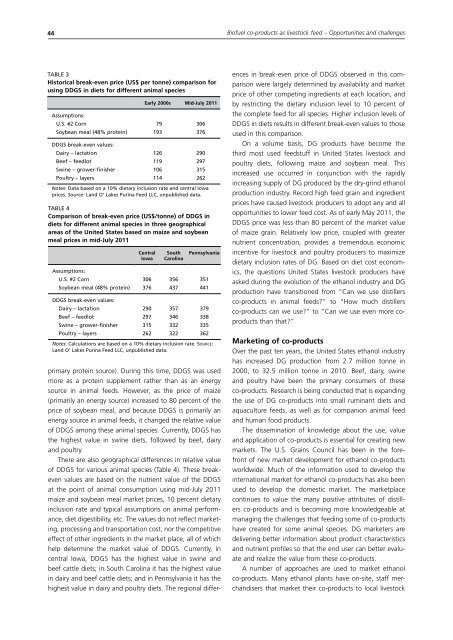
44<strong>Biofuel</strong> <strong>co</strong>-<strong>products</strong> <strong>as</strong> <strong>livestock</strong> <strong>feed</strong> – <strong>Opportunities</strong> <strong>and</strong> <strong>challenges</strong>TABLE 3Historical break-even price (US$ per tonne) <strong>co</strong>mparison forusing DDGS in diets for different animal speciesEarly 2000s Mid-July 2011Assumptions:U.S. #2 Corn 79 306Soybean meal (48% protein) 193 376DDGS break-even values:Dairy – lactation 126 290Beef – <strong>feed</strong>lot 119 297Swine – grower-finisher 106 315Poultry – layers 114 262Notes: Data b<strong>as</strong>ed on a 10% dietary inclusion rate <strong>and</strong> central Iowaprices. Source: L<strong>and</strong> O’ Lakes Purina Feed LLC, unpublished data.TABLE 4Comparison of break-even price (US$/tonne) of DDGS indiets for different animal species in three geographicalare<strong>as</strong> of the United States b<strong>as</strong>ed on maize <strong>and</strong> soybeanmeal prices in mid-July 2011CentralIowaSouthCarolinaPennsylvaniaAssumptions:U.S. #2 Corn 306 356 351Soybean meal (48% protein) 376 437 441DDGS break-even values:Dairy – lactation 290 357 379Beef – <strong>feed</strong>lot 297 346 338Swine – grower-finisher 315 332 335Poultry – layers 262 322 362Notes: Calculations are b<strong>as</strong>ed on a 10% dietary inclusion rate. SOURCE:L<strong>and</strong> O’ Lakes Purina Feed LLC, unpublished data.primary protein source). During this time, DDGS w<strong>as</strong> usedmore <strong>as</strong> a protein supplement rather than <strong>as</strong> an energysource in animal <strong>feed</strong>s. However, <strong>as</strong> the price of maize(primarily an energy source) incre<strong>as</strong>ed to 80 percent of theprice of soybean meal, <strong>and</strong> because DDGS is primarily anenergy source in animal <strong>feed</strong>s, it changed the relative valueof DDGS among these animal species. Currently, DDGS h<strong>as</strong>the highest value in swine diets, followed by beef, dairy<strong>and</strong> poultry.There are also geographical differences in relative valueof DDGS for various animal species (Table 4). These breakevenvalues are b<strong>as</strong>ed on the nutrient value of the DDGSat the point of animal <strong>co</strong>nsumption using mid-July 2011maize <strong>and</strong> soybean meal market prices, 10 percent dietaryinclusion rate <strong>and</strong> typical <strong>as</strong>sumptions on animal performance,diet digestibility, etc. The values do not reflect marketing,processing <strong>and</strong> transportation <strong>co</strong>st, nor the <strong>co</strong>mpetitiveeffect of other ingredients in the market place, all of whichhelp determine the market value of DDGS. Currently, incentral Iowa, DDGS h<strong>as</strong> the highest value in swine <strong>and</strong>beef cattle diets; in South Carolina it h<strong>as</strong> the highest valuein dairy <strong>and</strong> beef cattle diets; <strong>and</strong> in Pennsylvania it h<strong>as</strong> thehighest value in dairy <strong>and</strong> poultry diets. The regional differencesin break-even price of DDGS observed in this <strong>co</strong>mparisonwere largely determined by availability <strong>and</strong> marketprice of other <strong>co</strong>mpeting ingredients at each location, <strong>and</strong>by restricting the dietary inclusion level to 10 percent ofthe <strong>co</strong>mplete <strong>feed</strong> for all species. Higher inclusion levels ofDDGS in diets results in different break-even values to thoseused in this <strong>co</strong>mparison.On a volume b<strong>as</strong>is, DG <strong>products</strong> have be<strong>co</strong>me thethird most used <strong>feed</strong>stuff in United States <strong>livestock</strong> <strong>and</strong>poultry diets, following maize <strong>and</strong> soybean meal. Thisincre<strong>as</strong>ed use occurred in <strong>co</strong>njunction with the rapidlyincre<strong>as</strong>ing supply of DG produced by the dry-grind ethanolproduction industry. Re<strong>co</strong>rd high <strong>feed</strong> grain <strong>and</strong> ingredientprices have caused <strong>livestock</strong> producers to adopt any <strong>and</strong> allopportunities to lower <strong>feed</strong> <strong>co</strong>st. As of early May 2011, theDDGS price w<strong>as</strong> less than 80 percent of the market valueof maize grain. Relatively low price, <strong>co</strong>upled with greaternutrient <strong>co</strong>ncentration, provides a tremendous e<strong>co</strong>nomicincentive for <strong>livestock</strong> <strong>and</strong> poultry producers to maximizedietary inclusion rates of DG. B<strong>as</strong>ed on diet <strong>co</strong>st e<strong>co</strong>nomics,the questions United States <strong>livestock</strong> producers have<strong>as</strong>ked during the evolution of the ethanol industry <strong>and</strong> DGproduction have transitioned from “Can we use distillers<strong>co</strong>-<strong>products</strong> in animal <strong>feed</strong>s?” to “How much distillers<strong>co</strong>-<strong>products</strong> can we use?” to “Can we use even more <strong>co</strong><strong>products</strong>than that?”Marketing of <strong>co</strong>-<strong>products</strong>Over the p<strong>as</strong>t ten years, the United States ethanol industryh<strong>as</strong> incre<strong>as</strong>ed DG production from 2.7 million tonne in2000, to 32.5 million tonne in 2010. Beef, dairy, swine<strong>and</strong> poultry have been the primary <strong>co</strong>nsumers of these<strong>co</strong>-<strong>products</strong>. Research is being <strong>co</strong>nducted that is exp<strong>and</strong>ingthe use of DG <strong>co</strong>-<strong>products</strong> into small ruminant diets <strong>and</strong>aquaculture <strong>feed</strong>s, <strong>as</strong> well <strong>as</strong> for <strong>co</strong>mpanion animal <strong>feed</strong><strong>and</strong> human food <strong>products</strong>.The dissemination of knowledge about the use, value<strong>and</strong> application of <strong>co</strong>-<strong>products</strong> is essential for creating newmarkets. The U.S. Grains Council h<strong>as</strong> been in the forefrontof new market development for ethanol <strong>co</strong>-<strong>products</strong>worldwide. Much of the information used to develop theinternational market for ethanol <strong>co</strong>-<strong>products</strong> h<strong>as</strong> also beenused to develop the domestic market. The marketplace<strong>co</strong>ntinues to value the many positive attributes of distillers<strong>co</strong>-<strong>products</strong> <strong>and</strong> is be<strong>co</strong>ming more knowledgeable atmanaging the <strong>challenges</strong> that <strong>feed</strong>ing some of <strong>co</strong>-<strong>products</strong>have created for some animal species. DG marketers aredelivering better information about product characteristics<strong>and</strong> nutrient profiles so that the end user can better evaluate<strong>and</strong> realize the value from these <strong>co</strong>-<strong>products</strong>.A number of approaches are used to market ethanol<strong>co</strong>-<strong>products</strong>. Many ethanol plants have on-site, staff merch<strong>and</strong>isersthat market their <strong>co</strong>-<strong>products</strong> to local <strong>livestock</strong>