Textos de Apoio (pdf)
Textos de Apoio (pdf)
Textos de Apoio (pdf)

You also want an ePaper? Increase the reach of your titles
YUMPU automatically turns print PDFs into web optimized ePapers that Google loves.
Engine Layout and<br />
Load Diagrams<br />
Power functions and logarithmic<br />
scales<br />
As is well-known, the effective brake<br />
power P B<br />
of a diesel engine is proportional<br />
to the mean effective pressure<br />
(mep) p e<br />
and engine speed (rate of revolution)<br />
n. When using c as a constant,<br />
P B<br />
may then be expressed as follows:<br />
P B<br />
= c × p e<br />
× n<br />
or, in other words, for constant mep<br />
the power is proportional to the speed:<br />
P B<br />
= c × n 1<br />
(for constant mep)<br />
As already mentioned – when running<br />
with a fixed pitch propeller – the power<br />
may, according to the propeller law, be<br />
expressed as:<br />
P B<br />
= c × n 3<br />
(propeller law)<br />
Thus, for the above examples, the brake<br />
power P B<br />
may be expressed as a function<br />
of the speed n to the power of i, i.e.<br />
P B<br />
= c × n i<br />
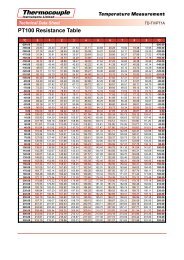
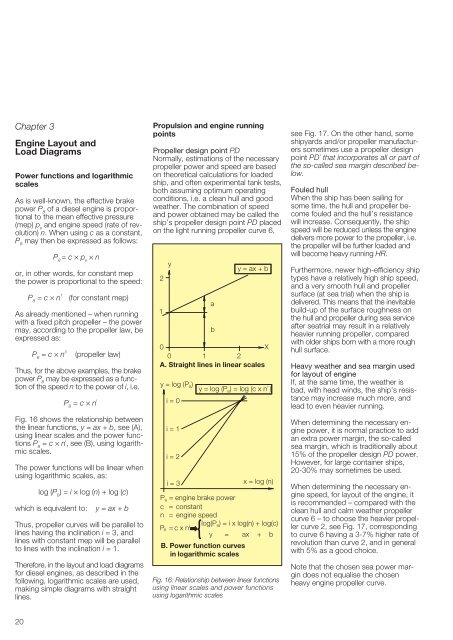
Fig. 16 shows the relationship between<br />
the linear functions, y = ax + b, see (A),<br />
using linear scales and the power functions<br />
P B<br />
= c × n i , see (B), using logarithmic<br />
scales.<br />
The power functions will be linear when<br />
using logarithmic scales, as:<br />
log (P B<br />
) = i × log (n) + log (c)<br />
which is equivalent to:<br />
y = ax + b<br />
Thus, propeller curves will be parallel to<br />
lines having the inclination i = 3, and<br />
lines with constant mep will be parallel<br />
to lines with the inclination i = 1.<br />
Therefore, in the layout and load diagrams<br />
for diesel engines, as <strong>de</strong>scribed in the<br />
following, logarithmic scales are used,<br />
making simple diagrams with straight<br />
lines.<br />
Propulsion and engine running<br />
points<br />
Propeller <strong>de</strong>sign point PD<br />
Normally, estimations of the necessary<br />
propeller power and speed are based<br />
on theoretical calculations for loa<strong>de</strong>d<br />
ship, and often experimental tank tests,<br />
both assuming optimum operating<br />
conditions, i.e. a clean hull and good<br />
weather. The combination of speed<br />
and power obtained may be called the<br />
ship’s propeller <strong>de</strong>sign point PD placed<br />
on the light running propeller curve 6,<br />
2<br />
1<br />
y<br />
a<br />
b<br />
y = ax + b<br />
0<br />
X<br />
0 1 2<br />
A. Straight lines in linear scales<br />
y = log (P )<br />
B<br />
i = 0<br />
i = 1<br />
i = 2<br />
i = 3<br />
i<br />
y = log (P<br />
B) = log (c x n )<br />
PB<br />
= engine brake power<br />
c = constant<br />
n = engine speed<br />
log( PB) = i x log(n) + log(c)<br />
P = c x n i<br />
B<br />
y = ax + b<br />
B. Power function curves<br />
in logarithmic scales<br />
x = log (n)<br />
Fig. 16: Relationship between linear functions<br />
using linear scales and power functions<br />
using logarithmic scales<br />
see Fig. 17. On the other hand, some<br />
shipyards and/or propeller manufacturers<br />
sometimes use a propeller <strong>de</strong>sign<br />
point PD´ that incorporates all or part of<br />
the so-called sea margin <strong>de</strong>scribed below.<br />
Fouled hull<br />
When the ship has been sailing for<br />
some time, the hull and propeller become<br />
fouled and the hull’s resistance<br />
will increase. Consequently, the ship<br />
speed will be reduced unless the engine<br />
<strong>de</strong>livers more power to the propeller, i.e.<br />
the propeller will be further loa<strong>de</strong>d and<br />
will become heavy running HR.<br />
Furthermore, newer high-efficiency ship<br />
types have a relatively high ship speed,<br />
and a very smooth hull and propeller<br />
surface (at sea trial) when the ship is<br />
<strong>de</strong>livered. This means that the inevitable<br />
build-up of the surface roughness on<br />
the hull and propeller during sea service<br />
after seatrial may result in a relatively<br />
heavier running propeller, compared<br />
with ol<strong>de</strong>r ships born with a more rough<br />
hull surface.<br />
Heavy weather and sea margin used<br />
for layout of engine<br />
If, at the same time, the weather is<br />
bad, with head winds, the ship’s resistance<br />
may increase much more, and<br />
lead to even heavier running.<br />
When <strong>de</strong>termining the necessary engine<br />
power, it is normal practice to add<br />
an extra power margin, the so-called<br />
sea margin, which is traditionally about<br />
15% of the propeller <strong>de</strong>sign PD power.<br />
However, for large container ships,<br />
20-30% may sometimes be used.<br />
When <strong>de</strong>termining the necessary engine<br />
speed, for layout of the engine, it<br />
is recommen<strong>de</strong>d – compared with the<br />
clean hull and calm weather propeller<br />
curve 6 – to choose the heavier propeller<br />
curve 2, see Fig. 17, corresponding<br />
to curve 6 having a 3-7% higher rate of<br />
revolution than curve 2, and in general<br />
with 5% as a good choice.<br />
Note that the chosen sea power margin<br />
does not equalise the chosen<br />
heavy engine propeller curve.<br />
20
![Conceitos transmissao de dados .Sinais[.pdf]](https://img.yumpu.com/50982145/1/190x146/conceitos-transmissao-de-dados-sinaispdf.jpg?quality=85)
![Packages e interfaces[.pdf]](https://img.yumpu.com/50629553/1/190x134/packages-e-interfacespdf.jpg?quality=85)