Textos de Apoio (pdf)
Textos de Apoio (pdf)
Textos de Apoio (pdf)

Create successful ePaper yourself
Turn your PDF publications into a flip-book with our unique Google optimized e-Paper software.
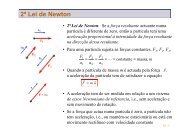
drawn in Fig. 22b. Point M is found on<br />
line 7 at MP’s speed.<br />
Example with controllable pitch propeller<br />
Example 5:<br />
With or without shaft generator<br />
Layout diagram – without shaft generator<br />
If a controllable pitch propeller (CPP)<br />
is applied, the combinator curve (of<br />
the propeller with optimum propeller<br />
efficiency) will normally be selected for<br />
loa<strong>de</strong>d ship including sea margin.<br />
For a given propeller speed, the combinator<br />
curve may have a given propeller<br />
pitch, and this means that, like for a fixed<br />
pitch propeller, the propeller may be<br />
heavy running in heavy weather.<br />
Power<br />
M: Specified MCR of engine<br />
S: Continuous service rating of engine<br />
O: Optimising point of engine<br />
A: Reference point of load diagram<br />
7<br />
5<br />
4<br />
1<br />
Combinator curve<br />
for loa<strong>de</strong>d ship<br />
and incl. sea margin<br />
3.3%A<br />
1<br />
Min<br />
speed<br />
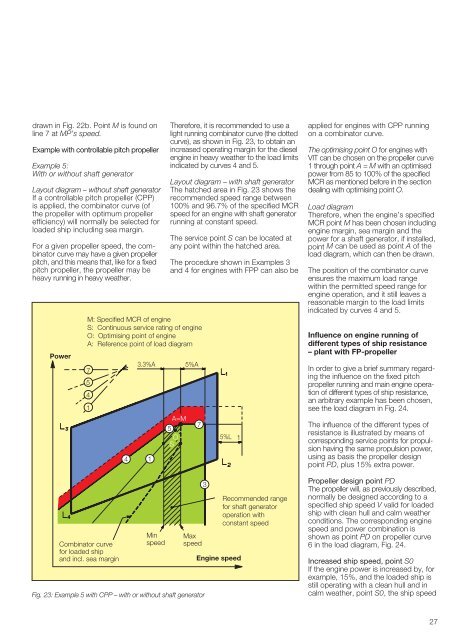
Therefore, it is recommen<strong>de</strong>d to use a<br />
light running combinator curve (the dotted<br />
curve), as shown in Fig. 23, to obtain an<br />
increased operating margin for the diesel<br />
engine in heavy weather to the load limits<br />
indicated by curves 4 and 5.<br />
Layout diagram – with shaft generator<br />
The hatched area in Fig. 23 shows the<br />
recommen<strong>de</strong>d speed range between<br />
100% and 96.7% of the specified MCR<br />
speed for an engine with shaft generator<br />
running at constant speed.<br />
The service point S can be located at<br />
any point within the hatched area.<br />
The procedure shown in Examples 3<br />
and 4 for engines with FPP can also be<br />
A=M<br />
5<br />
O<br />
S<br />
5%A<br />
7<br />
Max<br />
speed<br />
Fig. 23: Example 5 with CPP – with or without shaft generator<br />
4<br />
3<br />
5%L<br />
1<br />
Engine speed<br />
Recommen<strong>de</strong>d range<br />
for shaft generator<br />
operation with<br />
constant speed<br />
applied for engines with CPP running<br />
on a combinator curve.<br />
The optimising point O for engines with<br />
VIT can be chosen on the propeller curve<br />
1 through point A=Mwith an optimised<br />
power from 85 to 100% of the specified<br />
MCR as mentioned before in the section<br />
<strong>de</strong>aling with optimising point O.<br />
Load diagram<br />
Therefore, when the engine’s specified<br />
MCR point M has been chosen including<br />
engine margin, sea margin and the<br />
power for a shaft generator, if installed,<br />
point M can be used as point A of the<br />
load diagram, which can then be drawn.<br />
The position of the combinator curve<br />
ensures the maximum load range<br />
within the permitted speed range for<br />
engine operation, and it still leaves a<br />
reasonable margin to the load limits<br />
indicated by curves 4 and 5.<br />
Influence on engine running of<br />
different types of ship resistance<br />
– plant with FP-propeller<br />
In or<strong>de</strong>r to give a brief summary regarding<br />
the influence on the fixed pitch<br />
propeller running and main engine operation<br />
of different types of ship resistance,<br />
an arbitrary example has been chosen,<br />
see the load diagram in Fig. 24.<br />
The influence of the different types of<br />
resistance is illustrated by means of<br />
corresponding service points for propulsion<br />
having the same propulsion power,<br />
using as basis the propeller <strong>de</strong>sign<br />
point PD, plus 15% extra power.<br />
Propeller <strong>de</strong>sign point PD<br />
The propeller will, as previously <strong>de</strong>scribed,<br />
normally be <strong>de</strong>signed according to a<br />
specified ship speed V valid for loa<strong>de</strong>d<br />
ship with clean hull and calm weather<br />
conditions. The corresponding engine<br />
speed and power combination is<br />
shown as point PD on propeller curve<br />
6 in the load diagram, Fig. 24.<br />
Increased ship speed, point S0<br />
If the engine power is increased by, for<br />
example, 15%, and the loa<strong>de</strong>d ship is<br />
still operating with a clean hull and in<br />
calm weather, point S0, the ship speed<br />
27
![Conceitos transmissao de dados .Sinais[.pdf]](https://img.yumpu.com/50982145/1/190x146/conceitos-transmissao-de-dados-sinaispdf.jpg?quality=85)
![Packages e interfaces[.pdf]](https://img.yumpu.com/50629553/1/190x134/packages-e-interfacespdf.jpg?quality=85)