Textos de Apoio (pdf)
Textos de Apoio (pdf)
Textos de Apoio (pdf)

You also want an ePaper? Increase the reach of your titles
YUMPU automatically turns print PDFs into web optimized ePapers that Google loves.
The recommen<strong>de</strong>d use of a relatively<br />
high light running factor for <strong>de</strong>sign of<br />
the propeller will involve that a relatively<br />
higher propeller speed will be used for<br />
layout <strong>de</strong>sign of the propeller. This, in<br />
turn, may involve a minor reduction of<br />
the propeller efficiency, and may possibly<br />
cause the propeller manufacturer to<br />
abstain from using a large light running<br />
margin. However, this reduction of the<br />
propeller efficiency caused by the large<br />
light running factor is actually relatively<br />
insignificant compared with the improved<br />
engine performance obtained when<br />
sailing in heavy weather and/or with<br />
fouled hull and propeller.<br />
Use of layout and load<br />
diagrams - examples<br />
In the following, four different examples<br />
based on fixed pitch propeller (FPP)<br />
and one example based on controllable<br />
pitch propeller (CPP) are given in or<strong>de</strong>r<br />
to illustrate the flexibility of the layout<br />
and load diagrams.<br />
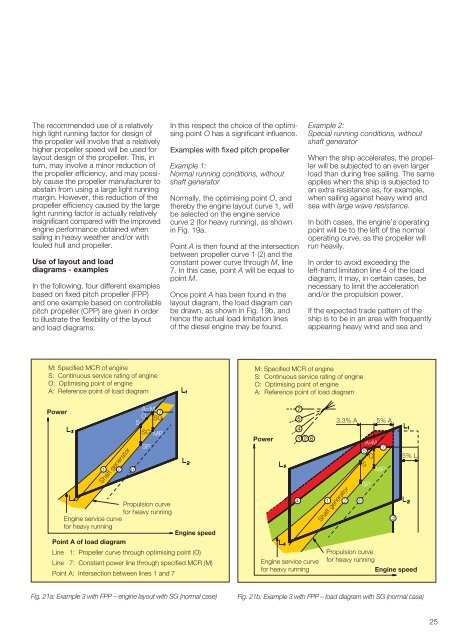
In this respect the choice of the optimising<br />
point O has a significant influence.<br />
Examples with fixed pitch propeller<br />
Example 1:<br />
Normal running conditions, without<br />
shaft generator<br />
Normally, the optimising point O, and<br />
thereby the engine layout curve 1, will<br />
be selected on the engine service<br />
curve 2 (for heavy running), as shown<br />
in Fig. 19a.<br />
Point A is then found at the intersection<br />
between propeller curve 1 (2) and the<br />
constant power curve through M, line<br />
7. In this case, point A will be equal to<br />
point M.<br />
Once point A has been found in the<br />
layout diagram, the load diagram can<br />
be drawn, as shown in Fig. 19b, and<br />
hence the actual load limitation lines<br />
of the diesel engine may be found.<br />
Example 2:<br />
Special running conditions, without<br />
shaft generator<br />
When the ship accelerates, the propeller<br />
will be subjected to an even larger<br />
load than during free sailing. The same<br />
applies when the ship is subjected to<br />
an extra resistance as, for example,<br />
when sailing against heavy wind and<br />
sea with large wave resistance.<br />
In both cases, the engine’s operating<br />
point will be to the left of the normal<br />
operating curve, as the propeller will<br />
run heavily.<br />
In or<strong>de</strong>r to avoid exceeding the<br />
left-hand limitation line 4 of the load<br />
diagram, it may, in certain cases, be<br />
necessary to limit the acceleration<br />
and/or the propulsion power.<br />
If the expected tra<strong>de</strong> pattern of the<br />
ship is to be in an area with frequently<br />
appearing heavy wind and sea and<br />
M: Specified MCR of engine<br />
S: Continuous service rating of engine<br />
O: Optimising point of engine<br />
A: Reference point of load diagram<br />
M: Specified MCR of engine<br />
S: Continuous service rating of engine<br />
O: Optimising point of engine<br />
A: Reference point of load diagram<br />
Power<br />
1 2<br />
Shaft generator<br />
6<br />
A=M<br />
7<br />
O SG<br />
S<br />
SG MP<br />
Propulsion curve<br />
for heavy running<br />
Engine service curve<br />
for heavy running<br />
Engine speed<br />
Point A of load diagram<br />
Line 1: Propeller curve through optimising point (O)<br />
Line 7: Constant power line through specified MCR (M)<br />
Point A: Intersection between lines 1 and 7<br />
SP<br />
Power<br />
7<br />
5<br />
4<br />
1 2 6<br />
4 1<br />
Engine service curve<br />
for heavy running<br />
3.3% A<br />
2<br />
Shaft generator<br />
6<br />
5% A<br />
A=M<br />
7<br />
5<br />
O<br />
S<br />
MP<br />
SP<br />
Propulsion curve<br />
for heavy running<br />
Engine speed<br />
3<br />
5% L 1<br />
Fig. 21a: Example 3 with FPP – engine layout with SG (normal case)<br />
Fig. 21b: Example 3 with FPP – load diagram with SG (normal case)<br />
25
![Conceitos transmissao de dados .Sinais[.pdf]](https://img.yumpu.com/50982145/1/190x146/conceitos-transmissao-de-dados-sinaispdf.jpg?quality=85)
![Packages e interfaces[.pdf]](https://img.yumpu.com/50629553/1/190x134/packages-e-interfacespdf.jpg?quality=85)