Textos de Apoio (pdf)
Textos de Apoio (pdf)
Textos de Apoio (pdf)

You also want an ePaper? Increase the reach of your titles
YUMPU automatically turns print PDFs into web optimized ePapers that Google loves.
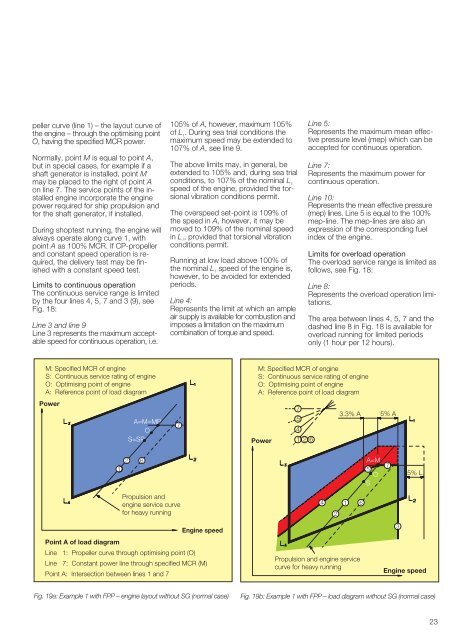
peller curve (line 1) – the layout curve of<br />
the engine – through the optimising point<br />
O, having the specified MCR power.<br />
Normally, point M is equal to point A,<br />
but in special cases, for example if a<br />
shaft generator is installed, point M<br />
may be placed to the right of point A<br />
on line 7. The service points of the installed<br />
engine incorporate the engine<br />
power required for ship propulsion and<br />
for the shaft generator, if installed.<br />
During shoptest running, the engine will<br />
always operate along curve 1, with<br />
point A as 100% MCR. If CP-propeller<br />
and constant speed operation is required,<br />
the <strong>de</strong>livery test may be finished<br />
with a constant speed test.<br />
Limits to continuous operation<br />
The continuous service range is limited<br />
by the four lines 4, 5, 7 and 3 (9), see<br />
Fig. 18:<br />
Line 3 and line 9<br />
Line 3 represents the maximum acceptable<br />
speed for continuous operation, i.e.<br />
105% of A, however, maximum 105%<br />
of L 1<br />
. During sea trial conditions the<br />
maximum speed may be exten<strong>de</strong>d to<br />
107% of A, see line 9.<br />
The above limits may, in general, be<br />
exten<strong>de</strong>d to 105% and, during sea trial<br />
conditions, to 107% of the nominal L 1<br />
speed of the engine, provi<strong>de</strong>d the torsional<br />
vibration conditions permit.<br />
The overspeed set-point is 109% of<br />
the speed in A, however, it may be<br />
moved to 109% of the nominal speed<br />
in L 1<br />
, provi<strong>de</strong>d that torsional vibration<br />
conditions permit.<br />
Running at low load above 100% of<br />
the nominal L 1<br />
speed of the engine is,<br />
however, to be avoi<strong>de</strong>d for exten<strong>de</strong>d<br />
periods.<br />
Line 4:<br />
Represents the limit at which an ample<br />
air supply is available for combustion and<br />
imposes a limitation on the maximum<br />
combination of torque and speed.<br />
Line 5:<br />
Represents the maximum mean effective<br />
pressure level (mep) which can be<br />
accepted for continuous operation.<br />
Line 7:<br />
Represents the maximum power for<br />
continuous operation.<br />
Line 10:<br />
Represents the mean effective pressure<br />
(mep) lines. Line 5 is equal to the 100%<br />
mep-line. The mep-lines are also an<br />
expression of the corresponding fuel<br />
in<strong>de</strong>x of the engine.<br />
Limits for overload operation<br />
The overload service range is limited as<br />
follows, see Fig. 18:<br />
Line 8:<br />
Represents the overload operation limitations.<br />
The area between lines 4, 5, 7 and the<br />
dashed line 8 in Fig. 18 is available for<br />
overload running for limited periods<br />
only (1 hour per 12 hours).<br />
M: Specified MCR of engine<br />
S: Continuous service rating of engine<br />
O: Optimising point of engine<br />
A: Reference point of load diagram<br />
M: Specified MCR of engine<br />
S: Continuous service rating of engine<br />
O: Optimising point of engine<br />
A: Reference point of load diagram<br />
Power<br />
A=M=MP<br />
O<br />
S=SP<br />
7<br />
7<br />
5<br />
4<br />
Power 1 2 6<br />
3.3% A<br />
5% A<br />
1<br />
2<br />
6<br />
A=M<br />
5<br />
O<br />
S<br />
7<br />
5% L 1<br />
Propulsion and<br />
engine service curve<br />
for heavy running<br />
4 1<br />
2<br />
6<br />
Engine speed<br />
Point A of load diagram<br />
Line 1: Propeller curve through optimising point (O)<br />
Line 7: Constant power line through specified MCR (M)<br />
Point A: Intersection between lines 1 and 7<br />
Propulsion and engine service<br />
curve for heavy running<br />
3<br />
Engine speed<br />
Fig. 19a: Example 1 with FPP – engine layout without SG (normal case)<br />
Fig. 19b: Example 1 with FPP – load diagram without SG (normal case)<br />
23
![Conceitos transmissao de dados .Sinais[.pdf]](https://img.yumpu.com/50982145/1/190x146/conceitos-transmissao-de-dados-sinaispdf.jpg?quality=85)
![Packages e interfaces[.pdf]](https://img.yumpu.com/50629553/1/190x134/packages-e-interfacespdf.jpg?quality=85)