

MicroStation System, MicroLog Version 4.2 - DTU Systems Biology ...
MicroStation System, MicroLog Version 4.2 - DTU Systems Biology ...
MicroStation System, MicroLog Version 4.2 - DTU Systems Biology ...

You also want an ePaper? Increase the reach of your titles
YUMPU automatically turns print PDFs into web optimized ePapers that Google loves.
Appendix 5: Program Printouts<br />
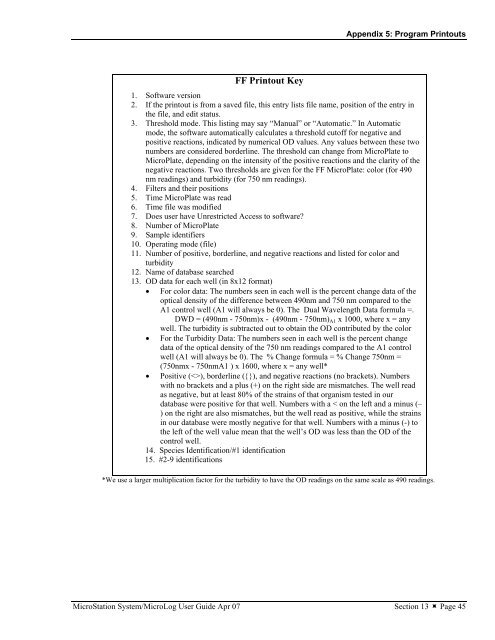
FF Printout Key<br />
1. Software version<br />
2. If the printout is from a saved file, this entry lists file name, position of the entry in<br />
the file, and edit status.<br />
3. Threshold mode. This listing may say “Manual” or “Automatic.” In Automatic<br />
mode, the software automatically calculates a threshold cutoff for negative and<br />
positive reactions, indicated by numerical OD values. Any values between these two<br />
numbers are considered borderline. The threshold can change from MicroPlate to<br />
MicroPlate, depending on the intensity of the positive reactions and the clarity of the<br />
negative reactions. Two thresholds are given for the FF MicroPlate: color (for 490<br />
nm readings) and turbidity (for 750 nm readings).<br />
4. Filters and their positions<br />
5. Time MicroPlate was read<br />
6. Time file was modified<br />
7. Does user have Unrestricted Access to software?<br />
8. Number of MicroPlate<br />
9. Sample identifiers<br />
10. Operating mode (file)<br />
11. Number of positive, borderline, and negative reactions and listed for color and<br />
turbidity<br />
12. Name of database searched<br />
13. OD data for each well (in 8x12 format)<br />
• For color data: The numbers seen in each well is the percent change data of the<br />
optical density of the difference between 490nm and 750 nm compared to the<br />
A1 control well (A1 will always be 0). The Dual Wavelength Data formula =.<br />
DWD = (490nm - 750nm)x - (490nm - 750nm)A1 x 1000, where x = any<br />
well. The turbidity is subtracted out to obtain the OD contributed by the color<br />
• For the Turbidity Data: The numbers seen in each well is the percent change<br />
data of the optical density of the 750 nm readings compared to the A1 control<br />
well (A1 will always be 0). The % Change formula = % Change 750nm =<br />
(750nmx - 750nmA1 ) x 1600, where x = any well*<br />
• Positive (), borderline ({}), and negative reactions (no brackets). Numbers<br />
with no brackets and a plus (+) on the right side are mismatches. The well read<br />
as negative, but at least 80% of the strains of that organism tested in our<br />
database were positive for that well. Numbers with a < on the left and a minus (–<br />
) on the right are also mismatches, but the well read as positive, while the strains<br />
in our database were mostly negative for that well. Numbers with a minus (-) to<br />
the left of the well value mean that the well’s OD was less than the OD of the<br />
control well.<br />
14. Species Identification/#1 identification<br />
15. #2-9 identifications<br />
*We use a larger multiplication factor for the turbidity to have the OD readings on the same scale as 490 readings.<br />
<strong>MicroStation</strong> <strong>System</strong>/<strong>MicroLog</strong> User Guide Apr 07 Section 13 � Page 45