

MicroStation System, MicroLog Version 4.2 - DTU Systems Biology ...
MicroStation System, MicroLog Version 4.2 - DTU Systems Biology ...
MicroStation System, MicroLog Version 4.2 - DTU Systems Biology ...

You also want an ePaper? Increase the reach of your titles
YUMPU automatically turns print PDFs into web optimized ePapers that Google loves.
On all progressive<br />
data windows:<br />
Click on a specific<br />
well to select it.<br />
Find well<br />
information in<br />
“Key” box.<br />
Click “Set to<br />
Current Data<br />
Value” to return<br />
all settings to<br />
number of positive<br />
reactions your<br />
current<br />
MicroPlate has.<br />
Interpreting Results<br />
Progressive data analysis<br />
<strong>MicroLog</strong> software uses a new method of pattern matching called<br />
Progressive ID (PID). The PID method takes into account the<br />
progressive nature by which purple color forms in the wells of the<br />
MicroPlate. What typically happens after cells are inoculated is that<br />
some wells turn purple quickly and strongly, resulting in dark purple<br />
wells. These are usually the preferred carbon source for the microbe.<br />
After additional incubation, other wells also turn purple, sometimes<br />
forming weaker purple wells.<br />
For example, if a MicroPlate has 23 purple wells, PID will compare<br />
the pattern to the other species in the database at their stage of<br />
development when they also had 23 purple wells. Each species in the<br />
database responds to the search, as if to say “This is my pattern when I<br />
had 23 positive reactions.” PID finds the best match among the species<br />
in the database. The mathematics of matching the species to the pattern<br />
is otherwise identical to that used in the previous method of End-point<br />
ID (EID).<br />
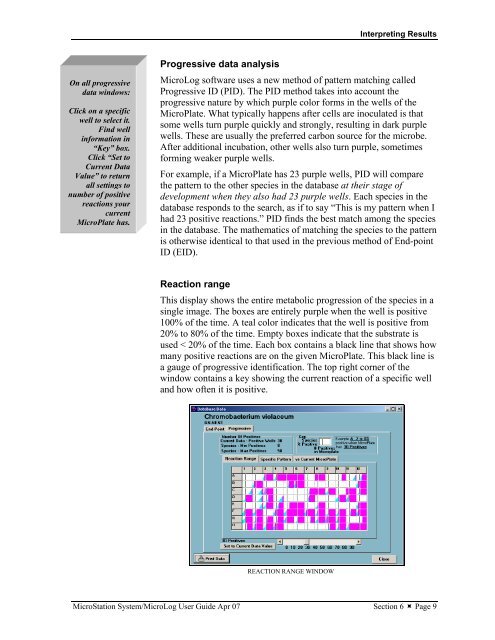
Reaction range<br />
This display shows the entire metabolic progression of the species in a<br />
single image. The boxes are entirely purple when the well is positive<br />
100% of the time. A teal color indicates that the well is positive from<br />
20% to 80% of the time. Empty boxes indicate that the substrate is<br />
used < 20% of the time. Each box contains a black line that shows how<br />
many positive reactions are on the given MicroPlate. This black line is<br />
a gauge of progressive identification. The top right corner of the<br />
window contains a key showing the current reaction of a specific well<br />
and how often it is positive.<br />
REACTION RANGE WINDOW<br />
<strong>MicroStation</strong> <strong>System</strong>/<strong>MicroLog</strong> User Guide Apr 07 Section 6 � Page 9