- Page 2 and 3:
Propuesta de políticapública para
- Page 4 and 5:
Construida con el aporte detodos lo
- Page 6 and 7:
4.9. Estructura y gobernanza del si
- Page 8 and 9:
que tenga sentido en lo educativo l
- Page 10 and 11:
dad, crítica y corrección de erro
- Page 12 and 13:
de meditar en el mapa estratégico
- Page 14 and 15:
+ + Para que todos los compatriotas
- Page 16 and 17:
Agradecimientos 1El CESU reconoce y
- Page 18 and 19:
Académicos de instituciones de edu
- Page 20 and 21:
OECD - OCDE Organisation for Econom
- Page 22 and 23:
1IntroducciónAcuerdo por lo Superi
- Page 24 and 25:
zaron y participaron, de manera pro
- Page 26 and 27:
olvidar el norte proyectado para el
- Page 28:
ior, contribuir significativamente
- Page 31 and 32: 2Se pueden identificar cuatro fases
- Page 33 and 34: de relaciones, actores, institucion
- Page 35 and 36: Además de todos los aportes recole
- Page 37 and 38: ) Los conversatorios departamentale
- Page 39: Se trabajó colectivamente la propu
- Page 43 and 44: De acuerdo con la Constitución, lo
- Page 45 and 46: + + Instituto Colombiano para la Ev
- Page 47 and 48: Bogotá, D. C. concentra el 30% de
- Page 49 and 50: Tabla no. 6. Tasa bruta de cobertur
- Page 51 and 52: Tabla no. 9. Tasa de cobertura brut
- Page 53 and 54: Tabla no. 11. Matrícula por ingres
- Page 55 and 56: Las matrículas de educación super
- Page 57 and 58: Tabla no. 16. Matrícula por área
- Page 59 and 60: Gráfica 5. Tasa de Deserción12,90
- Page 61 and 62: 3.3.3. Programas de formaciónA pes
- Page 63 and 64: El porcentaje de programas acredita
- Page 65 and 66: Tabla no. 26. Programas con acredit
- Page 67 and 68: Tabla no. 30. Títulos otorgados en
- Page 69 and 70: Tabla no. 34. Títulos otorgados de
- Page 71 and 72: Tabla no. 37. Índice de Progreso d
- Page 73 and 74: Gráfica 6. Índice de Progreso de
- Page 75 and 76: Tabla no. 40. Ingresos según nivel
- Page 77 and 78: Es de destacar que el área del con
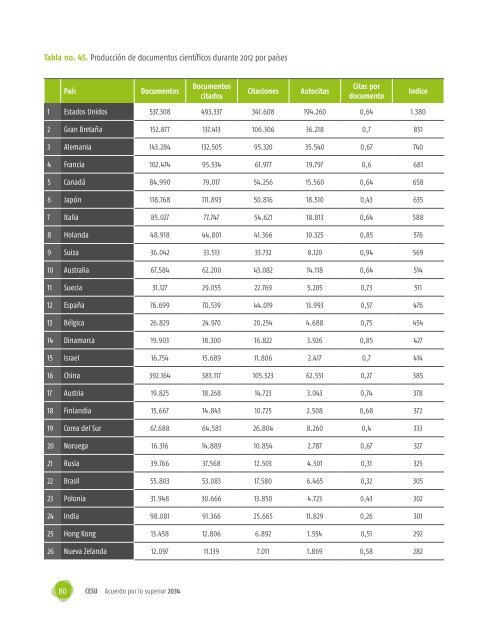
- Page 79: Tabla no. 44. Producción de docume
- Page 83 and 84: Tabla no. 46. Producción de docume
- Page 85 and 86: Tabla no. 50. Profesores según gé
- Page 87 and 88: Tabla no. 52. Evolución del gasto
- Page 89 and 90: . Financiamiento de la ofertaLa asi
- Page 91 and 92: En la actualidad, el porcentaje de
- Page 93 and 94: instituciones de educaciónsuperior
- Page 95 and 96: En este capítulo se exponen los di
- Page 97 and 98: oferta de educación superior afect
- Page 99 and 100: Gráfica no. 9. Sistema de Aseguram
- Page 101 and 102: De acuerdo con la Organización par
- Page 103 and 104: Vale la pena señalar que la innova
- Page 105 and 106: Gráfica no. 10. La regionalizació
- Page 107 and 108: total de departamentos evaluados, e
- Page 109 and 110: Esta enorme variedad de ofertas del
- Page 111 and 112: complementariedad y movilidad, valo
- Page 113 and 114: Las instituciones educativas deben
- Page 115 and 116: Estas modalidades de oferta educati
- Page 117 and 118: tratación, remuneración y evaluac
- Page 119 and 120: perfiles o resultados de aprendizaj
- Page 121 and 122: los programas TyT, y aseguren el lo
- Page 123 and 124: productos de crédito educativo a l
- Page 125 and 126: Sobre la demanda:20. La demanda de
- Page 127 and 128: En el capítulo precedente se han p
- Page 129 and 130: Las palabras de Jamil Salmi expresa
- Page 131 and 132:
cias propias de cada una de sus fun
- Page 133 and 134:
+ + organismos que fomenten y valor
- Page 135 and 136:
prometida con acciones de fomento y
- Page 137 and 138:
el sistema de educación superior c
- Page 139 and 140:
los aspectos disciplinares, didáct
- Page 141 and 142:
100. Contar con una estructura flex
- Page 143 and 144:
116. Dotar a las regiones de recurs
- Page 145 and 146:
133. Establecer una canasta educati
- Page 147 and 148:
Es hora de pasar a la acciónLa vis
- Page 149 and 150:
minación de los grupos de interés
- Page 151 and 152:
financiación y el sostenimiento de
- Page 153 and 154:
Gráfica no. 14. Educación Superio
- Page 155 and 156:
nuevos estudiantes, y el posgrado c
- Page 157 and 158:
Gráfica no. 16. Eje temático uno1
- Page 159 and 160:
Gráfica no. 17. Eje temático dos2
- Page 161 and 162:
Gráfica no. 18. Eje temático tres
- Page 163 and 164:
Gráfica no. 19. Eje temático cuat
- Page 165 and 166:
Gráfica no. 21. Eje temático seis
- Page 167 and 168:
Gráfica no. 22. Eje temático siet
- Page 169 and 170:
Gráfica no. 24. Eje temático nuev
- Page 171 and 172:
Gráfica no. 25. Eje temático diez
- Page 174 and 175:
Bibliografía1. Adelman, Clifford.
- Page 176 and 177:
36. Beelen, Jos La internacionaliza
- Page 178 and 179:
78. De la Fuente, A. & Ciccone, A.
- Page 180 and 181:
nalDevelopment/CurriculumDevelopmen
- Page 182 and 183:
cación superior. http://manecolomb
- Page 184 and 185:
211. Prieto Prieto, Manuel Francisc
- Page 186 and 187:
Informe Colombia, Red de Observator
- Page 190 and 191:
AnexosAcuerdo por lo Superior 2034P
- Page 192 and 193:
1- MODELODE EDUCACIÓNINCLUSIVA5- I
- Page 194 and 195:
3- INVESTIGACIÓN (CIENCIA, TECNOLO
- Page 196 and 197:
5 - SISTEMA RE-GIONAL DE EDUCA-CIÓ
- Page 198 and 199:
7 - UN MEJORBIENESTAR PARALA COMUNI
- Page 200 and 201:
7 - UN MEJORBIENESTAR PARALA COMUNI
- Page 202 and 203:
8 - PROMOCIÓNY ARTICULACIÓNDE LAS
- Page 204 and 205:
4. Fortalecer la estrategiade promo
- Page 206 and 207:
11 - NUEVAGOBERNANZA DELA EDUCACIÓ