- Page 1 and 2: THE UNIVERSITY OF CHICAGO THE PHONO
- Page 3 and 4: TABLE OF CONTENTS VOLUME ONE LIST O
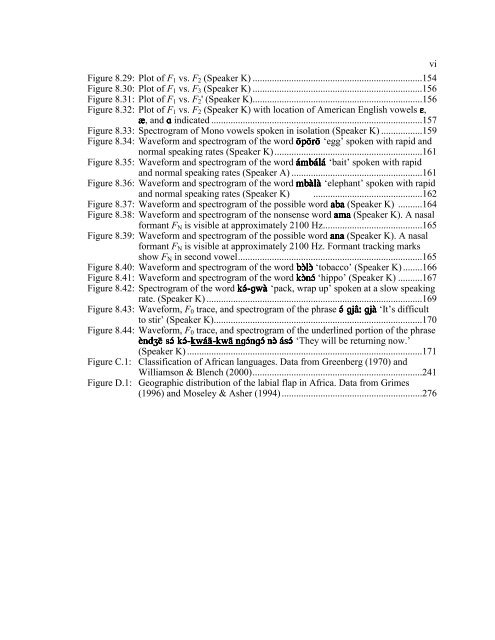
- Page 5: LIST OF FIGURES Figure 1.1: The lan
- Page 9 and 10: Rhodes, Jim Roberts, Doug Sampson,
- Page 11 and 12: ABSTRACT In this dissertation, I de
- Page 13 and 14: This dissertation is dedicated to t
- Page 15 and 16: There are several languages in the
- Page 17 and 18: The Bubanda region is located to th
- Page 19 and 20: convincing. More will be said about
- Page 21 and 22: Her phonological analysis consists
- Page 23 and 24: study informing the internal classi
- Page 25 and 26: men hunt small game, but large game
- Page 27 and 28: third of CAR. At its peak, the Uban
- Page 29 and 30: of Lingala is reduced, both for men
- Page 31 and 32: language. Also, code switching is n
- Page 33 and 34: Finally, several documents dealing
- Page 35 and 36: with the contrast between sounds, a
- Page 37 and 38: CHAPTER 2 PHONEMES In this chapter,
- Page 39 and 40: 4. Frequency of occurrence. If a so
- Page 41 and 42: Mono consonants share several trait
- Page 43 and 44: Despite the fact that the labial fl
- Page 45 and 46: The data in (1) show sample contras
- Page 47 and 48: However, contrasts are readily atte
- Page 49 and 50: case of the pronouns. If the pronou
- Page 51 and 52: 2.2 Vowels b. Labial-velar and lab
- Page 53 and 54: If = were reinterpreted as a low fr
- Page 55 and 56: The data in (19) show sample contra
- Page 57 and 58:
= Table 2.1: Consonant-vowel combin
- Page 59 and 60:
CHAPTER 3 TONE The majority of Afri
- Page 61 and 62:
(3) Tautomorphemic words containing
- Page 63 and 64:
3.2 Grammatical tone Besides the le
- Page 65 and 66:
(13) a. = = = = = C=@( C=@( C=@( C=
- Page 67 and 68:
Certain locative adverbs in Mono ha
- Page 69 and 70:
CHAPTER 4 LABIALIZATION AND PALATAL
- Page 71 and 72:
tongue position in addition to a pr
- Page 73 and 74:
However, this is not what we find.
- Page 75 and 76:
4.2 Suggested interpretations Chao
- Page 77 and 78:
each vowel in the sequence. She con
- Page 79 and 80:
consonant to be lower in sonority t
- Page 81 and 82:
entire word as its domain, which wo
- Page 83 and 84:
phonemically as ia, or as a semi-vo
- Page 85 and 86:
is suggested by Blevin’s (1995: 2
- Page 87 and 88:
. Alveolar ⎯ J =J=H= =J=H= =J=H=
- Page 89 and 90:
this is that these words bear stres
- Page 91 and 92:
Arabic, Japanese, Lardil, Estonian,
- Page 93 and 94:
(3) Underlying forms of sample V1CV
- Page 95 and 96:
the words, ‘far’, F F F F
- Page 97 and 98:
The adjective == == == == ‘small
- Page 99 and 100:
One question which arises is whethe
- Page 101 and 102:
1994, Elders 2000), most of which f
- Page 103 and 104:
In my corpus of data, adverbs begin
- Page 105 and 106:
contains several morphemes are term
- Page 107 and 108:
(2) Sample animate nouns a. C> C> C
- Page 109 and 110:
Second, certain adjectives are lexi
- Page 111 and 112:
Thus, according to Kamanda’s hypo
- Page 113 and 114:
(13) Sample compound nouns in Mono
- Page 115 and 116:
element begins with a vowel, vowel
- Page 117 and 118:
Cloarec-Heiss (1972: 86) for Linda.
- Page 119 and 120:
121) considers this to be an unprod
- Page 121 and 122:
document clearly the formal propert
- Page 123 and 124:
Repetitive aspect (REP). The repeti
- Page 125 and 126:
(31) a. ( ( ( ( I( I( I( I( (F= (F=
- Page 127 and 128:
There is a plural form ( (, ( ( whi
- Page 129 and 130:
7.1.3 Prepositional morphology Most
- Page 131 and 132:
(45) a. I( I( I( I( (= (= (= (=
- Page 133 and 134:
(49) a. ( ( ( ( → ~
- Page 135 and 136:
which reduces to '' ' ' in casual s
- Page 137 and 138:
CHAPTER 8 ACOUSTIC PHONETICS While
- Page 139 and 140:
This chapter consists of four parts
- Page 141 and 142:
Figure 8.2: Waveform and spectrogra
- Page 143 and 144:
Figure 8.4: Waveform and spectrogra
- Page 145 and 146:
languages on one hand (Degema and t
- Page 147 and 148:
Figure 8.8: Waveform of the possibl
- Page 149 and 150:
Figure 8.12: Waveform and spectrogr
- Page 151 and 152:
oth Speakers A and K. In Speaker A
- Page 153 and 154:
In the tokens I examined, then, I f
- Page 155 and 156:
ief glottalic ingressive mechanism,
- Page 157 and 158:
Figure 8.23: Waveform and spectrogr
- Page 159 and 160:
labial-velar stops is shorter than
- Page 161 and 162:
formant transitions at the release
- Page 163 and 164:
Figure 8.28: Waveform and spectrogr
- Page 165 and 166:
(1973) suggest plotting F1 vs. F2',
- Page 167 and 168:
Table 8.4: Bandwidth averages. Unit
- Page 169 and 170:
Figure 8.30: Plot of F1 vs. F3 (Spe
- Page 171 and 172:
Second, the value of F2 for the Mon
- Page 173 and 174:
start of or H. The second vowel wa
- Page 175 and 176:
Words with only two syllables shoul
- Page 177 and 178:
presence of a nasal formant at the
- Page 179 and 180:
Figures 8.40 and 8.41 show spectrog
- Page 181 and 182:
Second, I argue in Chapter 4 that l
- Page 183 and 184:
transition from the secondary artic
- Page 185 and 186:
linguistic universals and tendencie
- Page 187 and 188:
The two secondary articulations fou
- Page 189 and 190:
APPENDIX A TEXTS This appendix cont
- Page 191 and 192:
( 11. “>== >== >== >== =( =( =( =
- Page 193 and 194:
20. “A(FA( A(FA( A(FA( A(FA( == =
- Page 195 and 196:
33. “ @ @ @ @ J5(( J5(( J5(( J
- Page 197 and 198:
( 43. A@A A@A A@A A@A I( I( I( I( (
- Page 199 and 200:
( 55. J5A J5A J5A J5A =( =( =( =( =
- Page 201 and 202:
( ( ( =( =( =( =( ( ( ( ( MK( M
- Page 203 and 204:
( 9. =LKHK =LKHK =LKHK =LKHK A
- Page 205 and 206:
9. C> C> C> C> CA( CA( CA( CA( AC=
- Page 207 and 208:
Table A.2: Frequency counts of vowe
- Page 209 and 210:
=@AC =@AC =@AC =@AC n. bend, crook,
- Page 211 and 212:
== == == == M(A( M(A( M(A( M(A( n.
- Page 213 and 214:
(( ( >==C>= >==C>= >==C>= >==C>= CJ
- Page 215 and 216:
@A @A @A J5(( J5(( J5(( J5(( v. cho
- Page 217 and 218:
A(FA( A(FA( A(FA( A(FA( CKIK CKIK n
- Page 219 and 220:
C=>= C=>= C=>= C=>= v. honor, admir
- Page 221 and 222:
C>=@= C>=@= C>=@= C>=@= CK> CK> CK>
- Page 223 and 224:
ADJ. sharp. F F ADJ. tart. ADJ
- Page 225 and 226:
=5A =5A =5A =5A =C= =C= =C= =C= n.
- Page 227 and 228:
=>= =>= =>= =>= n. knife. #0929. =(
- Page 229 and 230:
= = = = Variant: >= >= >= >= n. ill
- Page 231 and 232:
F=IKHK F=IKHK F=IKHK F=IKHK n. slip
- Page 233 and 234:
C>@ C>@ C>@ C>@ (>= (>= (>= (>= n.
- Page 235 and 236:
H >H >H >H (5( (5( (5( (5( v. be dr
- Page 237 and 238:
— @ @ @ @ — @= @= @= @= v. vomi
- Page 239 and 240:
C>@ C>@ C>@ C>@ AAF= AAF= AAF= AAF=
- Page 241 and 242:
(C>( (C>( (C>( (C>( Variant: =(C>(
- Page 243 and 244:
I I I I @ @ @ @ A(FA( A(FA( A(FA( A
- Page 245 and 246:
J=@= J=@= J=@= J=@= n. lamp, torch.
- Page 247 and 248:
— J5 J5 — J5=( J5=( PREP.
- Page 249 and 250:
KK KK KK KK n. thigh (the part of t
- Page 251 and 252:
M=H M=H M=H M=H n. manioc paste. M=
- Page 253 and 254:
=M=( =M=( =M=( =M=( n. bitter herbs
- Page 255 and 256:
APPENDIX C AN EVALUATION OF NIGER-C
- Page 257 and 258:
changes to Greenberg’s work. This
- Page 259 and 260:
Williamson bases much of her classi
- Page 261 and 262:
original division between the two b
- Page 263 and 264:
Stewart and Williamson interpret th
- Page 265 and 266:
C.3.1 Inclusion of Bantu within Nig
- Page 267 and 268:
Third, the supposedly borrowed word
- Page 269 and 270:
Watters (1989: 409) notes that *KCM
- Page 271 and 272:
Congo. Greenberg (1970) named it Ad
- Page 273 and 274:
is already satisfied, and thus form
- Page 275 and 276:
The second major issue with respect
- Page 277 and 278:
difference of syllable structure) a
- Page 279 and 280:
published and personally elicited.
- Page 281 and 282:
languages compared. Consider a triv
- Page 283 and 284:
sound correspondences, and thus has
- Page 285 and 286:
in that they most often come about
- Page 287 and 288:
approximating gross groupings, ther
- Page 289 and 290:
The International Phonetic Alphabet
- Page 291 and 292:
One question which arises immediate
- Page 293 and 294:
Table D.1: Genetic affiliation of l
- Page 295 and 296:
This is identical to what Catford (
- Page 297 and 298:
D.5 Phonological status D.5.1 Evalu
- Page 299 and 300:
7. Borrowed words. If the sound is
- Page 301 and 302:
(4) Contrast with other labial soun
- Page 303 and 304:
(7) Sample lexical items in Karang
- Page 305 and 306:
which are shown in (11). Third, the
- Page 307 and 308:
distribution of the labial flap bea
- Page 309 and 310:
In addition, we provide evidence co
- Page 311 and 312:
South Mofu [MIF] (Cameroon). Barret
- Page 313 and 314:
the mouth (Karanga) or ‘of flicki
- Page 315 and 316:
ilabial or labiodental. Lim conside
- Page 317 and 318:
words are found in those subgroups.
- Page 319 and 320:
‘joint’, CM CM CM CM ‘ankle
- Page 321 and 322:
Feroge [FER] (Sudan). Santandrea (1
- Page 323 and 324:
the Méré dialect in the words CKL
- Page 325 and 326:
Mvuba [MXH] (D. R. Congo). Demolin
- Page 327 and 328:
Labial flap (1) Files labfl1_11025.
- Page 329 and 330:
Implosives and labialization (7) Fi
- Page 331 and 332:
(23) Secondary articulations I(
- Page 333 and 334:
(36) M= M= ‘send’ =(J= =(J= =(J
- Page 335 and 336:
MK( MK( I( I( I( I( AA AA AA AA
- Page 337 and 338:
Table F.1, continued. d. Labial con
- Page 339 and 340:
Table F.1, continued. e. Labial co
- Page 341 and 342:
Table F.1, continued. e. Alveolar c
- Page 343 and 344:
Table F.1, continued. e. Alveolar c
- Page 345 and 346:
Table F.1, continued. f. Palatal co
- Page 347 and 348:
Table F.1, continued. h. Palatal co
- Page 349 and 350:
Table F.1, continued. e. Velar/glot
- Page 351 and 352:
Table F.1, continued. d. Labial-vel
- Page 353 and 354:
Table F.2, continued. K E K@ K@
- Page 355 and 356:
Table F.3, continued. (12)
- Page 357 and 358:
Table F.4: Formant and bandwidth va
- Page 359 and 360:
Table F.4, continued. LA@= Spec 368
- Page 361 and 362:
Table F.4, continued. > Spec 326.
- Page 363 and 364:
Table F.4, continued. > Spec 532.86
- Page 365 and 366:
Table F.4, continued. > 5= Spec 619
- Page 367 and 368:
Table F.5, continued. E > 5= ‘two
- Page 369 and 370:
REFERENCES Arom, Simha, and France
- Page 371 and 372:
Buchanan, Michael. 1996. Rapport d
- Page 373 and 374:
Demolin, Didier. 1988. Some problem
- Page 375 and 376:
Greenberg, Joseph H. 1995. The conc
- Page 377 and 378:
International Phonetic Association.
- Page 379 and 380:
McCarthy, John J., and Alan S. Prin
- Page 381 and 382:
Pozzati, Aurelio. 1987. Vocabolario
- Page 383 and 384:
Thomas, Jacqueline M.-C. 1963. Le p


