Create successful ePaper yourself
Turn your PDF publications into a flip-book with our unique Google optimized e-Paper software.
Order-No. 7574 00 1X<br />
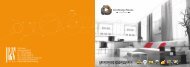
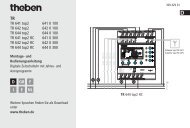
picture 12: Datalogger display in a display element<br />
Software "...590101"<br />
Functional description<br />
Up to two datalogger channels can be displayed as curves (24) & (25) in a display element (23).<br />
The curves to be displayed are selected using the parameters "Curve 1: datalogger channel"<br />
and "Curve 2: datalogger channel". Within a datalogger display element, only those channels<br />
with the same recording periods can be displayed.<br />
i The diagram size is directly affected by the size of the display element. Here, the minimum<br />
size should be maintained, according to the information shown and the scaling of the axes.<br />
If the minimum size is undershot, then it will not be possible to show the diagram on the<br />
panel display. In this case, the appropriate display element is filled with a cross.<br />
The Y axis (26) can be scaled dynamically according to the values to be displayed (specified by<br />
minimum and maximum values of the recording period) or, alternatively, can be permanently<br />
configured in a value range. If the scaling of the Y axis is fixed, and there is a data value outside<br />
the specified minimum or maximum limits, then the data value curve is drawn in vertically upwards<br />
or downwards from the two neighbouring data points.<br />
The scaling of the X axis is automatically specified by the configured recording period and the<br />
resulting time intervals of a datalogger channel. At the bottom left side of the X axis, the diagram<br />
always displays the time of the measured value of the first successfully evaluated interval<br />
of the previous recording period (27). The data value curve begins at this time. The bottom right<br />
item of the X axis displays the time at which the measured value of the last interval of the recording<br />
period was recorded (29). If only one interval was recorded, then the two displayed<br />
times are the same.<br />
The formatting of the date and time is specified in the top parameter node of the plug-in using<br />
the "Date display format" and "Time display format" parameters. The data - partially with special<br />
formatting - is only displayed for recording periods lasting several days, weeks or months. The<br />
time is only displayed on the X axis when the recording period is set to "Hour" or "Day".<br />
Both axes can be given subdivisions (29) and additional lines (30) to simplify the legibility of the<br />
diagrams.<br />
In the parameter group of the datalogger display, it is possible to configure a heading for the<br />
diagram (31) and names for each curve (32). In addition, "reinforcement" and "offset" can be<br />
added to the measured values of a channel to allow the option of modification of the desired<br />
measured value ranges in the diagram.<br />
In addition, the datalogger display parameters can be used to specify which recorded data value<br />
is to be displayed in the diagram as the "curve type" (maximum value, minimum value or average<br />
value). When a datalogger channel is displayed with differentials in the data value recording,<br />
it is not possible to select the curve type as there can only be one differential value displayed<br />
for each interval.<br />
A maximum of four datalogger displays can be configured on a screen page. A total of 50 datalogger<br />
displays can be created in the panel and distributed to different pages.<br />
Page 57 of 222