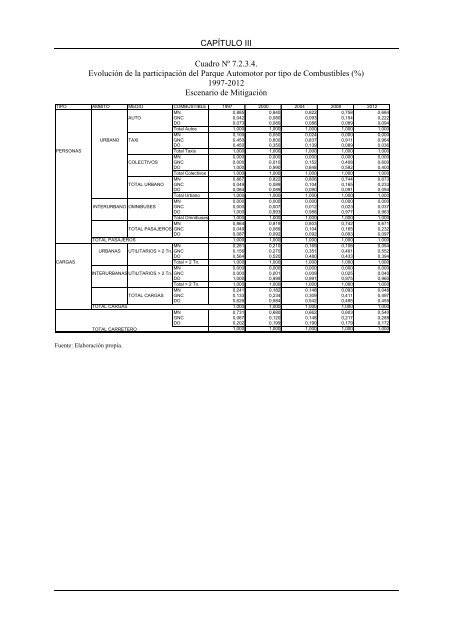
CAPÍTULO IIICuadro Nº 7.2.3.4.Evolución <strong>de</strong> <strong>la</strong> participación <strong>de</strong>l Parque Automotor por tipo <strong>de</strong> Combustibles (%)1997-2012Esc<strong>en</strong>ario <strong>de</strong> MitigaciónTIPO AMBITO MEDIO COMBUSTIBLE 1997 2000 2004 2008 2012MN 0,885 0,840 0,822 0,758 0,684AUTO GNC 0,042 0,080 0,093 0,154 0,222DO 0,073 0,080 0,086 0,089 0,094Total Autos 1,000 1,000 1,000 1,000 1,000MN 0,100 0,050 0,024 0,000 0,000URBANO TAXI GNC 0,450 0,600 0,837 0,911 0,964DO 0,450 0,350 0,139 0,089 0,036PERSONAS Total Taxis 1,000 1,000 1,000 1,000 1,000MN 0,000 0,000 0,000 0,000 0,000COLECTIVOS GNC 0,000 0,010 0,152 0,408 0,600DO 1,000 0,990 0,848 0,592 0,400Total Colectivos 1,000 1,000 1,000 1,000 1,000MN 0,867 0,822 0,806 0,744 0,673TOTAL URBANO GNC 0,049 0,089 0,104 0,165 0,233DO 0,084 0,089 0,090 0,091 0,094Total Urbano 1,000 1,000 1,000 1,000 1,000MN 0,000 0,000 0,000 0,000 0,000INTERURBANO OMNIBUSES GNC 0,000 0,007 0,012 0,023 0,037DO 1,000 0,993 0,988 0,977 0,963Total Omnibuses 1,000 1,000 1,000 1,000 1,000MN 0,864 0,819 0,803 0,742 0,671TOTAL PASAJEROS GNC 0,049 0,089 0,104 0,165 0,232DO 0,087 0,092 0,092 0,093 0,097TOTAL PASAJEROS 1,000 1,000 1,000 1,000 1,000MN 0,281 0,210 0,169 0,106 0,054URBANAS UTILITARIOS < 2 Tn. GNC 0,156 0,270 0,351 0,461 0,552DO 0,564 0,520 0,480 0,433 0,394CARGAS Total < 2 Tn. 1,000 1,000 1,000 1,000 1,000MN 0,000 0,000 0,000 0,000 0,000INTERURBANAS UTILITARIOS > 2 Tn. GNC 0,000 0,001 0,009 0,025 0,040DO 1,000 0,999 0,991 0,975 0,960Total > 2 Tn. 1,000 1,000 1,000 1,000 1,000MN 0,241 0,182 0,148 0,093 0,048TOTAL CARGAS GNC 0,133 0,234 0,309 0,411 0,497DO 0,626 0,584 0,542 0,495 0,455TOTAL CARGAS 1,000 1,000 1,000 1,000 1,000MN 0,731 0,680 0,662 0,603 0,540GNC 0,067 0,120 0,148 0,217 0,288DO 0,202 0,199 0,190 0,179 0,172TOTAL CARRETERO1,000 1,000 1,000 1,000 1,000Fu<strong>en</strong>te: E<strong>la</strong>boración propia.
CAPÍTULO IIICuadro Nº 7.2.3.5.Comparación <strong>en</strong>tre los Esc<strong>en</strong>arios <strong>de</strong> <strong>la</strong>s Participaciones <strong>de</strong>lParque Automotor por tipo <strong>de</strong> combustibles(%) (Unida<strong>de</strong>s)1997-2012TIPO AMBITO MEDIO COMBUSTIBLE 19972012ESC. BASE ESC.MITIGACIONMN 88,5 83,5 68,4AUTO GNC 4,2 6,0 22,2DO 7,3 10,5 9,4Total Autos 4.813.388,0 8.465.339,0 8.465.339,0MN 10,0 0,0 0,0URBANO TAXI GNC 45,0 47,0 96,4DO 45,0 53,0 3,6PERSONAS Total Taxis 88.220,0 107.445,0 107.445,0MN 0,0 0,0 0,0COLECTIVOS GNC 0,0 4,0 60,0DO 100,0 96,0 40,0Total Colectivos 24.383,0 30.141,0 30.141,0MN 86,7 82,2 67,3TOTAL URBANO GNC 4,9 6,5 23,3DO 8,4 11,3 9,4Total Urbano 4.925.991,0 8.602.925,0 8.602.925,0MN 0,0 0,0 0,0INTERURBANO OMNIBUSES GNC 0,0 0,0 3,7DO 100,0 1,0 96,3Total Omnibuses 16.256,0 24.856,0 24.856,0MN 86,4 81,9 67,1TOTAL PASAJEROS GNC 4,9 6,5 23,2DO 8,7 11,6 9,7TOTAL PASAJEROS4.942.247,0 8.627.781,0 8.627.781,0MN 28,1 17,0 5,4URBANAS UTILITARIOS < 2 Tn. GNC 15,6 21,0 55,2DO 56,4 62,0 39,4CARGAS Total < 2 Tn. 1.147.802,0 2.053.780,0 2.053.780,0MN 0,0 0,0 0,0INTERURBANAS UTILITARIOS > 2 Tn. GNC 0,0 0,0 4,0DO 100,0 100,0 96,0Total > 2 Tn. 190.603,0 247.482,0 247.482,0MN 24,1 15,2 4,8TOTAL CARGAS GNC 13,3 18,7 49,7DO 62,6 66,1 45,5TOTAL CARGAS 1.338.405,0 2.301.262,0 2.301.262,0MN 73,1 67,9 54,0GNC 6,7 9,1 28,8DO 20,2 23,1 17,2TOTAL CARRETERO TOTAL GRAL. 6.280.652,0 10.929.043,0 10.929.043,0Fu<strong>en</strong>te: E<strong>la</strong>boración propia.c) Análisis <strong>de</strong> resultados• Tanto <strong>en</strong> <strong>el</strong> Esc<strong>en</strong>ario <strong>de</strong> Base como <strong>en</strong> <strong>el</strong> Mitigación, crece <strong>la</strong> participación <strong>de</strong>l GNC <strong>en</strong> todos losmedios don<strong>de</strong> está pres<strong>en</strong>te.• En <strong>el</strong> Esc<strong>en</strong>ario <strong>de</strong> Base, <strong>el</strong> GNC pasa, para <strong>el</strong> Parque Total, <strong>de</strong> repres<strong>en</strong>tar <strong>el</strong> 6,7% <strong>en</strong> 1997 al 9,1% <strong>en</strong> <strong>el</strong> año 2012.Salvo <strong>en</strong> <strong>el</strong> caso <strong>de</strong> los colectivos, don<strong>de</strong> inicialm<strong>en</strong>te <strong>el</strong> Gas Oil t<strong>en</strong>ía <strong>el</strong> 100% <strong>de</strong>l Parque, <strong>en</strong> losrestantes medios se constata <strong>la</strong> política explícita <strong>de</strong> dies<strong>el</strong>ización.El GNC continúa su p<strong>en</strong>etración mo<strong>de</strong>rada <strong>en</strong> Autos, Taxis y Cargas <strong>de</strong> m<strong>en</strong>os <strong>de</strong> 2 Tn.• En <strong>el</strong> Esc<strong>en</strong>ario <strong>de</strong> Mitigación, <strong>el</strong> GNC alcanza <strong>el</strong> 28,8 % <strong>de</strong>l parque Total <strong>en</strong> <strong>el</strong> año 2012. Es<strong>de</strong>cir algo más <strong>de</strong> tres veces que <strong>en</strong> <strong>el</strong> Esc<strong>en</strong>ario Base y casi cuadruplicando su participación respecto<strong>de</strong> 1997.