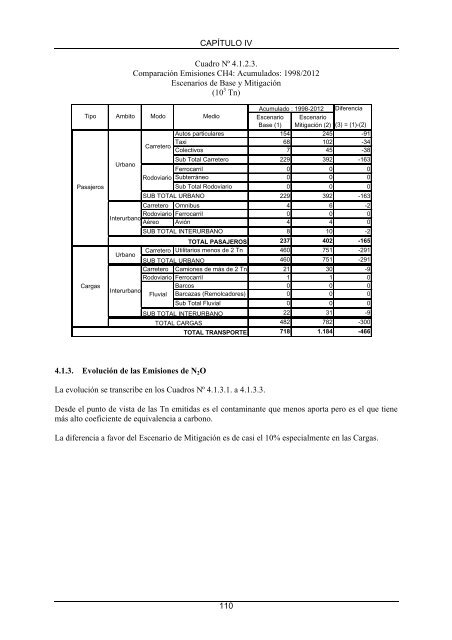
CAPÍTULO IVCuadro Nº 4.1.2.3.Comparación Emisiones CH4: Acumu<strong>la</strong>dos: 1998/2012Esc<strong>en</strong>arios <strong>de</strong> Base y Mitigación(10 3 Tn)Acumu<strong>la</strong>do : 1998-2012 Difer<strong>en</strong>ciaTipo Ambito Modo MedioEsc<strong>en</strong>arioBase (1)Esc<strong>en</strong>arioMitigación (2) (3) = (1)-(2)Autos particu<strong>la</strong>res 154 245 -91CarreteroTaxi 68 102 -34Colectivos 7 45 -38PasajerosCargasUrbanoRodoviarioSub Total Carretero 229 392 -163Ferrocarril 0 0 0Subterráneo 0 0 0SUB TOTAL URBANOSub Total Rodoviario 0 0 0229 392 -163Carretero Omnibus 4 6 -2Rodoviario Ferrocarril 0 0 0InterurbanoAéreo Avión 4 4 0SUB TOTAL INTERURBANO8 10 -2TOTAL PASAJEROS237 402 -165Carretero Utilitarios m<strong>en</strong>os <strong>de</strong> 2 Tn 460 751 -291UrbanoSUB TOTAL URBANO460 751 -291Carretero Camiones <strong>de</strong> más <strong>de</strong> 2 Tn 21 30 -9Rodoviario Ferrocarril 1 1 0Barcos 0 0 0InterurbanoFluvial Barcazas (Remolcadores) 0 0 0Sub Total Fluvial 0 0 0SUB TOTAL INTERURBANOTOTAL CARGASTOTAL TRANSPORTE22 31 -9482 782 -300718 1.184 -4664.1.3. Evolución <strong>de</strong> <strong>la</strong>s Emisiones <strong>de</strong> N 2 OLa evolución se transcribe <strong>en</strong> los Cuadros Nº 4.1.3.1. a 4.1.3.3.Des<strong>de</strong> <strong>el</strong> punto <strong>de</strong> vista <strong>de</strong> <strong>la</strong>s Tn emitidas es <strong>el</strong> contaminante que m<strong>en</strong>os aporta pero es <strong>el</strong> que ti<strong>en</strong>emás alto co<strong>efici<strong>en</strong>te</strong> <strong>de</strong> equival<strong>en</strong>cia a carbono.La difer<strong>en</strong>cia a favor <strong>de</strong>l Esc<strong>en</strong>ario <strong>de</strong> Mitigación es <strong>de</strong> casi <strong>el</strong> 10% especialm<strong>en</strong>te <strong>en</strong> <strong>la</strong>s Cargas.110
CAPÍTULO IVCuadro Nº 4.1.3.1.Evolución <strong>de</strong> <strong>la</strong>s Emisiones <strong>de</strong> N2OEsc<strong>en</strong>ario <strong>de</strong> Base(10 3 Tn)Tipo Ambito Modo Medio 1997 2000 2004 2008 2012Acumu<strong>la</strong>do1998-2012Autos particu<strong>la</strong>res 0,136 0,145 0,170 0,205 0,238 2,461CarreteroTaxi 0,011 0,013 0,015 0,015 0,015 0,202Colectivos 0,045 0,048 0,049 0,050 0,050 0,719UrbanoSub Total Carretero 0,192 0,206 0,234 0,269 0,303 3,381Ferrocarril 0,001 0,001 0,001 0,001 0,001 0,019Rodoviario Subterráneo 0,000 0,000 0,000 0,000 0,000 0,000PasajerosSub Total Rodoviario 0,001 0,001 0,001 0,001 0,001 0,019SUB TOTAL URBANO0,194 0,207 0,235 0,270 0,304 3,400Carretero Omnibus 0,040 0,043 0,047 0,051 0,057 0,680Rodoviario Ferrocarril 0,001 0,000 0,000 0,000 0,000 0,007InterurbanoAéreo Avión 0,000 0,000 0,000 0,000 0,000 0,000SUB TOTAL INTERURBANO0,040 0,044 0,048 0,052 0,057 0,687TOTAL PASAJEROS 0,234 0,250 0,283 0,322 0,361 4,087UrbanoCarretero Utilitarios m<strong>en</strong>os <strong>de</strong> 2 Tn 0,272 0,299 0,349 0,406 0,446 4,983SUB TOTAL URBANO0,272 0,299 0,349 0,406 0,446 4,983Carretero Camiones <strong>de</strong> más <strong>de</strong> 2 Tn 0,237 0,249 0,268 0,293 0,309 3,925Rodoviario Ferrocarril 0,011 0,012 0,015 0,019 0,023 0,215CargasBarcos 0,000 0,000 0,000 0,000 0,000 0,000InterurbanoFluvial Barcazas (Remolcadores) 0,005 0,005 0,005 0,005 0,005 0,076Sub Total Fluvial 0,005 0,005 0,005 0,005 0,005 0,076SUB TOTAL INTERURBANO0,252 0,266 0,288 0,317 0,337 4,216TOTAL CARGAS0,524 0,565 0,638 0,723 0,784 9,199TOTAL TRANSPORTE 0,758 0,815 0,920 1,045 1,145 13,287Cuadro Nº 4.1.3.2.Evolución <strong>de</strong> <strong>la</strong>s Emisiones <strong>de</strong> N2OEsc<strong>en</strong>ario <strong>de</strong> Mitigación(10 3 Tn)Tipo Ambito Modo Medio1997 2000 2004 2008 2012Acumu<strong>la</strong>do1998-2012Autos particu<strong>la</strong>res 0,136 0,145 0,170 0,205 0,238 2,461CarreteroTaxi 0,011 0,013 0,015 0,015 0,015 0,202Colectivos 0,045 0,048 0,049 0,050 0,050 0,719UrbanoSub Total Carretero 0,192 0,206 0,234 0,269 0,303 3,381Ferrocarril 0,001 0,001 0,001 0,001 0,001 0,019Rodoviario Subterráneo 0,000 0,000 0,000 0,000 0,000 0,000PasajerosSub Total Rodoviario 0,001 0,001 0,001 0,001 0,001 0,019SUB TOTAL URBANO0,194 0,207 0,235 0,270 0,304 3,400Carretero Omnibus 0,040 0,043 0,047 0,051 0,057 0,680Rodoviario Ferrocarril 0,001 0,000 0,000 0,000 0,000 0,007InterurbanoAéreo Avión 0,000 0,000 0,000 0,000 0,000 0,000SUB TOTAL INTERURBANO0,040 0,044 0,048 0,052 0,057 0,687TOTAL PASAJEROS 0,234 0,250 0,283 0,322 0,361 4,087UrbanoCarretero Utilitarios m<strong>en</strong>os <strong>de</strong> 2 Tn 0,272 0,299 0,349 0,406 0,446 4,983SUB TOTAL URBANO0,272 0,299 0,349 0,406 0,446 4,983Carretero Camiones <strong>de</strong> más <strong>de</strong> 2 Tn 0,237 0,249 0,268 0,293 0,309 3,925Rodoviario Ferrocarril 0,011 0,012 0,015 0,019 0,023 0,215CargasBarcos 0,000 0,000 0,000 0,000 0,000 0,000InterurbanoFluvial Barcazas (Remolcadores) 0,005 0,005 0,005 0,005 0,005 0,076Sub Total Fluvial 0,005 0,005 0,005 0,005 0,005 0,076SUB TOTAL INTERURBANO0,252 0,266 0,288 0,317 0,337 4,216TOTAL CARGAS0,524 0,565 0,638 0,723 0,784 9,199TOTAL TRANSPORTE 0,758 0,815 0,920 1,045 1,145 13,287111