uso eficiente de la energÃa en el sector transporte - Ãreas de Gestión
uso eficiente de la energÃa en el sector transporte - Ãreas de Gestión
uso eficiente de la energÃa en el sector transporte - Ãreas de Gestión

You also want an ePaper? Increase the reach of your titles
YUMPU automatically turns print PDFs into web optimized ePapers that Google loves.
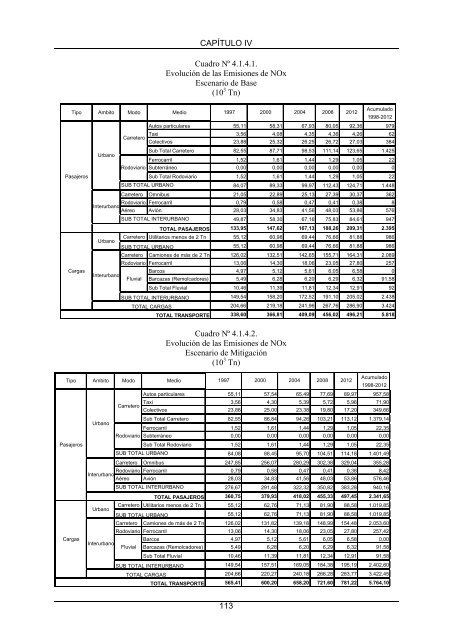
CAPÍTULO IVCuadro Nº 4.1.4.1.Evolución <strong>de</strong> <strong>la</strong>s Emisiones <strong>de</strong> NOxEsc<strong>en</strong>ario <strong>de</strong> Base(10 3 Tn)Tipo Ambito Modo Medio 1997 2000 2004 2008 2012PasajerosCargasUrbanoAcumu<strong>la</strong>do1998-2012Autos particu<strong>la</strong>res 55,11 58,31 67,93 80,05 92,36 979Taxi 3,56 4,08 4,35 4,36 4,26 62Colectivos 23,88 25,32 26,25 26,72 27,03 384Sub Total Carretero 82,55 87,71 98,53 111,14 123,65 1.425Ferrocarril 1,52 1,61 1,44 1,29 1,05 22Rodoviario Subterráneo 0,00 0,00 0,00 0,00 0,00 0Sub Total Rodoviario 1,52 1,61 1,44 1,29 1,05 2284,07 89,33 99,97 112,43 124,71 1.448Carretero Omnibus 21,05 22,89 25,13 27,39 30,37 362Rodoviario Ferrocarril 0,79 0,58 0,47 0,41 0,38 8InterurbanoAéreo Avión 28,03 34,83 41,56 48,03 53,86 576UrbanoInterurbanoCarreteroSUB TOTAL URBANOSUB TOTAL INTERURBANO49,87 58,30 67,16 75,83 84,61 947133,95 147,62 167,13 188,26 209,31 2.395Carretero Utilitarios m<strong>en</strong>os <strong>de</strong> 2 Tn 55,12 60,98 69,44 76,66 81,88 986SUB TOTAL URBANO55,12 60,98 69,44 76,66 81,88 986Carretero Camiones <strong>de</strong> más <strong>de</strong> 2 Tn 126,02 132,51 142,65 155,71 164,31 2.089Rodoviario Ferrocarril 13,06 14,30 18,06 23,05 27,80 257FluvialTOTAL PASAJEROSBarcos 4,97 5,12 5,61 6,05 6,58 0Barcazas (Remolcadores) 5,49 6,28 6,20 6,29 6,32 91,58Sub Total Fluvial 10,46 11,39 11,81 12,34 12,91 92SUB TOTAL INTERURBANOTOTAL CARGASTOTAL TRANSPORTE149,54 158,20 172,52 191,10 205,02 2.438204,66 219,18 241,96 267,76 286,90 3.424338,60 366,81 409,09 456,02 496,21 5.818Tipo Ambito Modo MedioPasajerosCargasUrbanoCuadro Nº 4.1.4.2.Evolución <strong>de</strong> <strong>la</strong>s Emisiones <strong>de</strong> NOxEsc<strong>en</strong>ario <strong>de</strong> Mitigación(10 3 Tn)Acumu<strong>la</strong>do1998-2012Autos particu<strong>la</strong>res 55,11 57,54 65,49 77,69 89,97 957,58Taxi 3,56 4,30 5,39 5,72 5,96 71,90Colectivos 23,88 25,00 23,38 19,80 17,20 349,66Sub Total Carretero 82,55 86,84 94,26 103,21 113,12 1.379,14Ferrocarril 1,52 1,61 1,44 1,29 1,05 22,35Rodoviario Subterráneo 0,00 0,00 0,00 0,00 0,00 0,00Sub Total Rodoviario 1,52 1,61 1,44 1,29 1,05 22,3584,08 88,45 95,70 104,51 114,18 1.401,49Carretero Omnibus 247,85 256,07 280,29 302,38 329,04 355,28Rodoviario Ferrocarril 0,79 0,58 0,47 0,41 0,38 8,42InterurbanoAéreo Avión 28,03 34,83 41,56 48,03 53,86 576,46UrbanoInterurbanoCarreteroSUB TOTAL URBANOSUB TOTAL INTERURBANO276,67 291,48 322,32 350,82 383,28 940,16360,75 379,93 418,02 455,33 497,45 2.341,65Carretero Utilitarios m<strong>en</strong>os <strong>de</strong> 2 Tn 55,12 62,76 71,13 81,90 88,58 1.019,85SUB TOTAL URBANO55,12 62,76 71,13 81,90 88,58 1.019,85Carretero Camiones <strong>de</strong> más <strong>de</strong> 2 Tn 126,02 131,82 139,18 148,99 154,48 2.053,60Rodoviario Ferrocarril 13,06 14,30 18,06 23,05 27,80 257,42FluvialBarcos 4,97 5,12 5,61 6,05 6,58 0,00Barcazas (Remolcadores) 5,49 6,28 6,20 6,29 6,32 91,58Sub Total Fluvial 10,46 11,39 11,81 12,34 12,91 91,58SUB TOTAL INTERURBANOTOTAL CARGASTOTAL PASAJEROSTOTAL TRANSPORTE1997 2000 2004 20082012149,54 157,51 169,05 184,38 195,19 2.402,60204,66 220,27 240,18 266,28 283,77 3.422,45565,41 600,20 658,20 721,60 781,22 5.764,10113