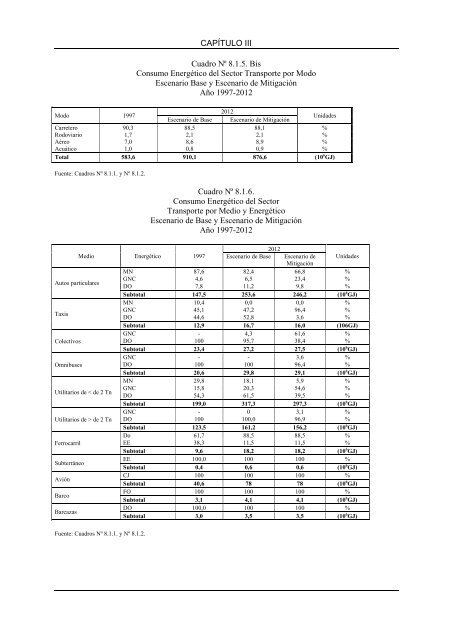
CAPÍTULO IIICuadro Nº 8.1.5. BisConsumo Energético <strong>de</strong>l Sector Transporte por ModoEsc<strong>en</strong>ario Base y Esc<strong>en</strong>ario <strong>de</strong> MitigaciónAño 1997-2012Modo 19972012Esc<strong>en</strong>ario <strong>de</strong> Base Esc<strong>en</strong>ario <strong>de</strong> MitigaciónUnida<strong>de</strong>sCarretero 90,3 88,5 88,1 %Rodoviario 1,7 2,1 2,1 %Aéreo 7,0 8,6 8,9 %Acuático 1,0 0,8 0,9 %Total 583,6 910,1 876,6 (10 6 GJ)Fu<strong>en</strong>te: Cuadros Nº 8.1.1. y Nº 8.1.2.Cuadro Nº 8.1.6.Consumo Energético <strong>de</strong>l SectorTransporte por Medio y EnergéticoEsc<strong>en</strong>ario <strong>de</strong> Base y Esc<strong>en</strong>ario <strong>de</strong> MitigaciónAño 1997-20122012Medio Energético 1997 Esc<strong>en</strong>ario <strong>de</strong> Base Esc<strong>en</strong>ario <strong>de</strong> Unida<strong>de</strong>sMitigaciónMN 87,6 82,4 66,8 %Autos particu<strong>la</strong>resGNC 4,6 6,5 23,4 %DO 7,8 11,2 9,8 %Subtotal 147,5 253,6 246,2 (10 6 GJ)MN 10,4 0,0 0,0 %TaxisGNC 45,1 47,2 96,4 %DO 44,6 52,8 3,6 %Subtotal 12,9 16,7 16,0 (106GJ)GNC - 4,3 61,6 %ColectivosDO 100 95,7 38,4 %Subtotal 23,4 27,2 27,5 (10 6 GJ)GNC - - 3,6 %OmnibusesDO 100 100 96,4 %Subtotal 20,6 29,8 29,1 (10 6 GJ)MN 29,8 18,1 5,9 %Utilitarios <strong>de</strong> < <strong>de</strong> 2 TnGNC 15,8 20,3 54,6 %DO 54,3 61,5 39,5 %Subtotal 199,0 317,3 297,3 (10 6 GJ)GNC - 0 3,1 %Utilitarios <strong>de</strong> > <strong>de</strong> 2 Tn DO 100 100,0 96,9 %Subtotal 123,5 161,2 156,2 (10 6 GJ)Do 61,7 88,5 88,5 %FerrocarrilEE 38,3 11,5 11,5 %Subtotal 9,6 18,2 18,2 (10 6 GJ)SubterráneoEE 100,0 100 100 %Subtotal 0,4 0,6 0,6 (10 6 GJ)AviónCJ 100 100 100 %Subtotal 40,6 78 78 (10 6 GJ)BarcoFO 100 100 100 %Subtotal 3,1 4,1 4,1 (10 6 GJ)BarcazasDO 100,0 100 100 %Subtotal 3,0 3,5 3,5 (10 6 GJ)Fu<strong>en</strong>te: Cuadros Nº 8.1.1. y Nº 8.1.2.
CAPÍTULO IIICuadro Nº 8.1.7.Consumo Energético <strong>de</strong>l Sector Transporte por MedioEsc<strong>en</strong>ario Base y Esc<strong>en</strong>ario <strong>de</strong> MitigaciónAño 1997-20122012 Tasa anual acumu<strong>la</strong>tiva (%)Medio 1997 Esc<strong>en</strong>ario <strong>de</strong>BaseEsc<strong>en</strong>ario <strong>de</strong> MitigaciónUnida<strong>de</strong>s Esc<strong>en</strong>ario <strong>de</strong>BaseEsc<strong>en</strong>ario <strong>de</strong>MitigaciónAutos particu<strong>la</strong>res 25,3 27,7 21,1 % 3.67 3.47Taxis 2,2 1,8 1,8 % 1.74 1.44Colectivos 4,0 3,0 3,1 % 1.0 1.1Omnibuses 3,5 3,3 3,3 % 2.50 2.33Utilitarios <strong>de</strong> < 2 Tn 34,1 34,9 33,9 % 3.16 2.71Utilitarios <strong>de</strong> > 2 Tn 21,2 17,7 17,8 % 1.80 1.58Ferrocarril 1,6 2,0 2,1 % 4.36 4.36Subterráneo 0,1 0,1 0,1 % 2.73 2.73Avión 7,0 8,6 8,9 % 4.45 4.45Barco 0,5 0,5 0,5 % 1.88 1.88Barcaza 0,5 0,4 0,4 % 1.0 1.0Total 583,6 910,1 876,6 (10 6 GJ) 3.0 2.74Fu<strong>en</strong>te: Cuadros Nº 8.1.1. y Nº 8.1.2.8.2. El análisis <strong>de</strong> los Resultadosa) Por tipo <strong>de</strong> Transporte Energético (Cuadro Nº 8.1.3.)Es más dinámico <strong>el</strong> <strong>transporte</strong> <strong>de</strong> Personas que <strong>el</strong> <strong>de</strong> Cargas ya que éstas consumían <strong>el</strong> 57,5%<strong>de</strong> <strong>la</strong> <strong>en</strong>ergía <strong>en</strong> 1997 y bajan al 55,1% y 54,3% <strong>en</strong> <strong>el</strong> año 2012 para <strong>el</strong> Esc<strong>en</strong>ario Base y <strong>el</strong>Esc<strong>en</strong>ario Mitigación respectivam<strong>en</strong>te.Esto obe<strong>de</strong>ce, es<strong>en</strong>cialm<strong>en</strong>te, al mayor crecimi<strong>en</strong>to re<strong>la</strong>tivo <strong>de</strong>l consumo <strong>de</strong> los Automóviles.La estructura <strong>de</strong> consumo por <strong>en</strong>ergético <strong>de</strong>nota: un mayor crecimi<strong>en</strong>to <strong>de</strong> <strong>la</strong> tasa <strong>de</strong> p<strong>en</strong>etración<strong>de</strong>l GNC <strong>en</strong> Personas que <strong>en</strong> Cargas <strong>en</strong> <strong>el</strong> Esc<strong>en</strong>ario <strong>de</strong> Mitigación; <strong>la</strong> fuerte sustitución<strong>de</strong> <strong>la</strong>s MN <strong>en</strong> Cargas; <strong>la</strong> difer<strong>en</strong>cia <strong>de</strong> participación <strong>de</strong>l Dies<strong>el</strong> (Gas Oil) <strong>en</strong>tre ambos Esc<strong>en</strong>arios(que es una hipótesis <strong>de</strong> partida); <strong>la</strong> importancia <strong>de</strong>l Combustible Jet (vincu<strong>la</strong>da a <strong>la</strong> expansión<strong>en</strong> <strong>el</strong> <strong>transporte</strong> <strong>de</strong> pasajeros por Avión) y los pesos, muy escasos, <strong>de</strong> <strong>la</strong> Electricidad(Tr<strong>en</strong>es y Subtes) y <strong>de</strong>l Fu<strong>el</strong> Oil (Barcos).b) Por Ambito y Energético (Cuadro Nº 8.1.4.)El consumo <strong>en</strong> <strong>el</strong> ámbito Urbano crece más que <strong>en</strong> <strong>el</strong> Interurbano.La inclusión <strong>en</strong> Urbano <strong>de</strong>l <strong>transporte</strong> <strong>de</strong> cargas <strong>de</strong> los vehículos Utilitarios <strong>de</strong> m<strong>en</strong>os <strong>de</strong> 2 Tnmuestra que <strong>el</strong> GNC es es<strong>en</strong>cialm<strong>en</strong>te un combustible para zonas urbanas y <strong>el</strong> Dies<strong>el</strong> para Interurbanasy <strong>la</strong>s MN son exclusivam<strong>en</strong>te Urbanas.El bajo peso re<strong>la</strong>tivo <strong>de</strong> <strong>la</strong> Electricidad evi<strong>de</strong>ncia escaso grado <strong>de</strong> <strong>el</strong>ectrificación, que comohipótesis realista se asume, para <strong>el</strong> Ambito Urbano.c) Por Modo y Energético (Cuadros Nº 8.1.5. y 8.1.5. bis)Como se m<strong>en</strong>cionó <strong>en</strong> <strong>el</strong> Capítulo I <strong>el</strong> Modo Carretero domina ampliam<strong>en</strong>te <strong>el</strong> sistema <strong>de</strong><strong>transporte</strong> <strong>en</strong> Arg<strong>en</strong>tina, y lo seguirá haci<strong>en</strong>do <strong>en</strong> <strong>el</strong> futuro consi<strong>de</strong>rado <strong>en</strong> este docum<strong>en</strong>to,aunque disminuye <strong>en</strong> poco más <strong>de</strong> dos puntos su participación respecto <strong>de</strong> 1997.