TIPO AMBITO MODO MEDIOCAPÍTULO IIICuadro Nº 8.1.2.Consumo Energético <strong>de</strong>l Sector Transporte <strong>en</strong>Arg<strong>en</strong>tina por Tipo, Ambito, Modo, Medio y Energético1997/2000/2004/2008/2012(10 6 GJ) Esc<strong>en</strong>ario <strong>de</strong> MitigaciónCOMBUSTIBLE 1997 2000 2004 2008 2012MN 129,2 128,7 143,6 156,9 164,5GNC 6,7 13,4 17,8 34,8 57,6AUTO DO 11,5 13,2 16,1 19,8 24,1Total Autos 147,5 155,3 177,6 211,5 246,2MN 1,3 0,8 0,4 0,0 0,0TAXIS GNC 5,8 8,7 13,0 14,5 15,5DO 5,7 5,0 2,1 1,4 0,6CARRETERO Total Taxis 12,9 14,4 15,5 15,9 16,0GNC 0,0 0,3 4,1 11,2 16,9COLECTIVOS DO 23,4 24,4 21,4 15,2 10,5Total Colectivos 23,4 24,7 25,5 26,5 27,5MN 130,6 129,4 144,0 156,9 164,5SUBTOTAL GNC 12,5 22,3 34,9 60,5 90,0CARRETERO DO 40,7 42,6 39,6 36,5 35,2URBANO Total Carretero Urbano 183,7 194,4 218,6 253,9 289,7FERROVIARIO DO 0,8 0,9 0,8 0,7 0,6EE 1,2 1,3 1,6 1,9 2,1RODOVIARIO Total FFCC Urbano 2,0 2,2 2,4 2,6 2,7SUBTERRANEO EE 0,4 0,4 0,5 0,5 0,6Total SUBTE Urbano 0,4 0,4 0,5 0,5 0,6Sub Total Rodoviario DO 0,8 0,9 0,8 0,7 0,6EE 1,6 1,7 2,0 2,5 2,6Total Rodoviario Urbano 2,4 2,6 2,8 3,2 3,2MN 130,6 129,4 144,0 156,9 164,5GNC 12,5 22,3 34,9 60,5 90,0DO 41,5 43,5 40,4 37,2 35,8EE 1,6 1,7 2,0 2,5 2,6SUBTOTAL URBANO SUBTOTAL URBANO 186,2 197,0 221,4 257,1 292,9GNC 0,0 0,1 0,3 0,6 1,0CARRETERO OMNIBUS DO 20,6 22,1 24,0 25,8 28,1Total OMNIBUS 20,6 22,2 24,2 26,4 29,1RODOVIARIO FERROVIARIO DO 0,4 0,3 0,3 0,2 0,2INTERURBANO Total FFCC Interurbano 0,4 0,3 0,3 0,2 0,2AEREO AVION CJ 40,6 50,4 60,1 69,5 78,0Total AEREO 40,6 50,4 60,1 69,5 78,0GNC 0,0 0,1 0,3 0,6 1,0DO 21,1 22,4 24,2 26,0 28,3CJ 40,6 50,4 60,1 69,5 78,0SUBTOTAL INTERURBANO SUBTOTAL INTERURBANO 61,6 72,9 84,6 96,1 107,3MN 130,6 129,4 144,0 156,9 164,5GNC 12,5 22,5 35,2 61,1 91,0DO 62,6 65,9 64,7 63,2 64,1SUBTOTAL PERSONAS EE 1,6 1,7 2,0 2,5 2,6CJ 40,6 50,4 60,1 69,5 78,0FO 0,0 0,0 0,0 0,0 0,0SUBTOTAL PERSONAS 247,8 269,9 306,0 353,2 400,2MN 59,4 48,6 44,4 31,5 17,4CARRETERO UTILITARIOS < 2 TN GNC 31,5 61,2 86,4 126,9 162,3DO 108,1 109,5 115,9 120,1 117,6URBANO TOTAL UTILITARIOS < 2 Tn. 199,0 219,3 246,7 278,5 297,3MN 59,4 48,6 44,4 31,5 17,4SUBTOTAL URBANO GNC 31,5 61,2 86,4 126,9 162,3DO 108,1 109,5 115,9 120,1 117,6TOTAL URBANO 199,0 219,3 246,7 278,5 297,3GNC 0,0 0,1 0,9 2,9 4,9CARRETERO UTILITARIOS > 2 TN DO 123,5 129,1 136,5 146,1 151,3TOTAL UTILITARIOS > 2 Tn. 123,5 129,2 137,4 149,0 156,2RODOVIARIO FERROVIARIO DO 7,2 7,9 9,9 12,7 15,3Total FFCC Cargas 7,2 7,9 9,9 12,7 15,3FO 3,1 3,2 3,5 3,8 4,1INTERURBANO ACUATICO BARCOS Total BARCOS 3,1 3,2 3,5 3,8 4,1BARCAZAS DO 3,0 3,5 3,4 3,5 3,5(Remolcadores) Total Barcazas (Remolcadores) 3,0 3,5 3,4 3,5 3,5SUBTOTAL DO 3,0 3,5 3,4 3,5 3,5ACUATICO FO 3,1 3,2 3,5 3,8 4,1Total Acuático 6,1 6,7 6,9 7,2 7,6GNC 0,0 0,1 0,9 2,9 4,9DO 133,7 140,5 149,8 162,2 170,1SUBTOTAL INTERURBANO FO 3,1 3,2 3,5 3,8 4,1SUBTOTAL INTERURBANO CARGAS 136,8 143,8 154,2 168,9 179,1MN 59,4 48,6 44,4 31,5 17,4GNC 31,5 61,3 87,3 129,8 167,2SUBTOTAL CARAGS DO 241,8 250,0 265,7 282,3 287,6FO 3,1 3,2 3,5 3,8 4,1SUBTOTAL CARGAS 335,8 363,1 400,9 447,4 476,4MN 190,0 178,1 188,4 188,4 181,9GNC 44,0 83,8 122,5 190,9 258,2DO 304,4 315,9 330,3 345,5 351,7TOTAL TRANSPORTE EE 1,6 1,7 2,0 2,5 2,6CJ 40,6 50,4 60,1 69,5 78,0FO 3,1 3,2 3,5 3,8 4,1TOTAL TRANSPORTE 583,6 633,0 706,9 800,6 876,6Fu<strong>en</strong>te: E<strong>la</strong>boración propia.
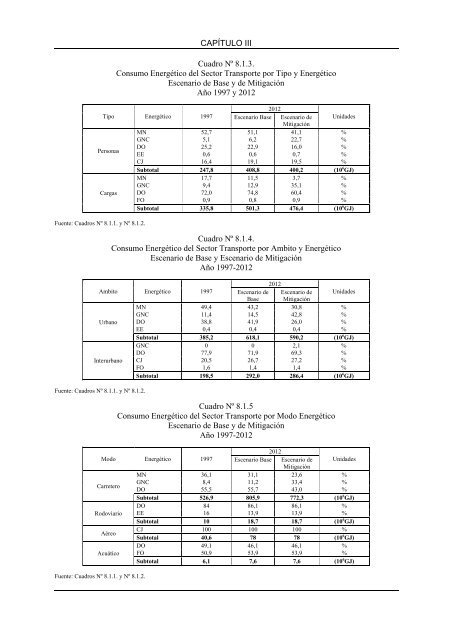
CAPÍTULO IIICuadro Nº 8.1.3.Consumo Energético <strong>de</strong>l Sector Transporte por Tipo y EnergéticoEsc<strong>en</strong>ario <strong>de</strong> Base y <strong>de</strong> MitigaciónAño 1997 y 20122012Tipo Energético 1997 Esc<strong>en</strong>ario Base Esc<strong>en</strong>ario <strong>de</strong> Unida<strong>de</strong>sMitigaciónMN 52,7 51,1 41,1 %GNC 5,1 6,2 22,7 %PersonasDO 25,2 22,9 16,0 %EE 0,6 0,6 0,7 %CJ 16,4 19,1 19,5 %Subtotal 247,8 408,8 400,2 (10 6 GJ)MN 17,7 11,5 3,7 %GNC 9,4 12,9 35,1 %Cargas DO 72,0 74,8 60,4 %FO 0,9 0,8 0,9 %Subtotal 335,8 501,3 476,4 (10 6 GJ)Fu<strong>en</strong>te: Cuadros Nº 8.1.1. y Nº 8.1.2.Cuadro Nº 8.1.4.Consumo Energético <strong>de</strong>l Sector Transporte por Ambito y EnergéticoEsc<strong>en</strong>ario <strong>de</strong> Base y Esc<strong>en</strong>ario <strong>de</strong> MitigaciónAño 1997-20122012Ambito Energético 1997 Esc<strong>en</strong>ario <strong>de</strong> Esc<strong>en</strong>ario <strong>de</strong> Unida<strong>de</strong>sBase MitigaciónMN 49,4 43,2 30,8 %GNC 11,4 14,5 42,8 %Urbano DO 38,8 41,9 26,0 %EE 0,4 0,4 0,4 %Subtotal 385,2 618,1 590,2 (10 6 GJ)GNC 0 0 2,1 %DO 77,9 71,9 69,3 %Interurbano CJ 20,5 26,7 27,2 %FO 1,6 1,4 1,4 %Subtotal 198,5 292,0 286,4 (10 6 GJ)Fu<strong>en</strong>te: Cuadros Nº 8.1.1. y Nº 8.1.2.Cuadro Nº 8.1.5Consumo Energético <strong>de</strong>l Sector Transporte por Modo EnergéticoEsc<strong>en</strong>ario <strong>de</strong> Base y <strong>de</strong> MitigaciónAño 1997-20122012Modo Energético 1997 Esc<strong>en</strong>ario Base Esc<strong>en</strong>ario <strong>de</strong> Unida<strong>de</strong>sMitigaciónMN 36,1 31,1 23,6 %CarreteroGNC 8,4 11,2 33,4 %DO 55,5 55,7 43,0 %Subtotal 526,9 805,9 772,3 (10 6 GJ)DO 84 86,1 86,1 %Rodoviario EE 16 13,9 13,9 %Subtotal 10 18,7 18,7 (10 6 GJ)AéreoCJ 100 100 100 %Subtotal 40,6 78 78 (10 6 GJ)DO 49,1 46,1 46,1 %Acuático FO 50,9 53,9 53,9 %Subtotal 6,1 7,6 7,6 (10 6 GJ)Fu<strong>en</strong>te: Cuadros Nº 8.1.1. y Nº 8.1.2.