uso eficiente de la energÃa en el sector transporte - Ãreas de Gestión
uso eficiente de la energÃa en el sector transporte - Ãreas de Gestión
uso eficiente de la energÃa en el sector transporte - Ãreas de Gestión

You also want an ePaper? Increase the reach of your titles
YUMPU automatically turns print PDFs into web optimized ePapers that Google loves.
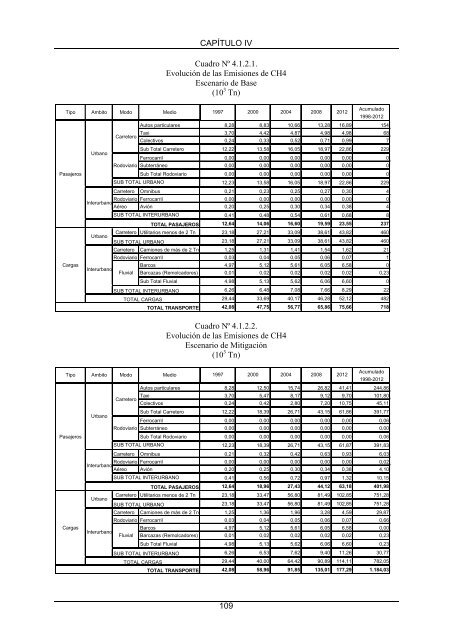
CAPÍTULO IVCuadro Nº 4.1.2.1.Evolución <strong>de</strong> <strong>la</strong>s Emisiones <strong>de</strong> CH4Esc<strong>en</strong>ario <strong>de</strong> Base(10 3 Tn)Tipo Ambito Modo Medio 1997 2000 2004 2008 2012Acumu<strong>la</strong>do1998-2012Autos particu<strong>la</strong>res 8,28 8,83 10,66 13,28 16,89 154CarreteroTaxi 3,70 4,42 4,87 4,98 4,98 68Colectivos 0,24 0,33 0,52 0,71 0,99 7UrbanoSub Total Carretero 12,22 13,58 16,05 18,97 22,86 229Ferrocarril 0,00 0,00 0,00 0,00 0,00 0Rodoviario Subterráneo 0,00 0,00 0,00 0,00 0,00 0PasajerosSub Total Rodoviario 0,00 0,00 0,00 0,00 0,00 0SUB TOTAL URBANO12,23 13,58 16,05 18,97 22,86 229Carretero Omnibus 0,21 0,23 0,25 0,27 0,30 4Rodoviario Ferrocarril 0,00 0,00 0,00 0,00 0,00 0InterurbanoAéreo Avión 0,20 0,25 0,30 0,34 0,38 4SUB TOTAL INTERURBANO0,41 0,48 0,54 0,61 0,68 8TOTAL PASAJEROS 12,64 14,06 16,60 19,59 23,55 237UrbanoCarretero Utilitarios m<strong>en</strong>os <strong>de</strong> 2 Tn 23,18 27,21 33,09 38,61 43,82 460SUB TOTAL URBANO23,18 27,21 33,09 38,61 43,82 460Carretero Camiones <strong>de</strong> más <strong>de</strong> 2 Tn 1,25 1,31 1,41 1,54 1,62 21Rodoviario Ferrocarril 0,03 0,04 0,05 0,06 0,07 1CargasBarcos 4,97 5,12 5,61 6,05 6,58 0InterurbanoFluvial Barcazas (Remolcadores) 0,01 0,02 0,02 0,02 0,02 0,23Sub Total Fluvial 4,98 5,13 5,62 6,06 6,60 0SUB TOTAL INTERURBANO6,26 6,48 7,08 7,66 8,29 22TOTAL CARGAS29,44 33,69 40,17 46,28 52,12 482TOTAL TRANSPORTE 42,08 47,75 56,77 65,86 75,66 718Cuadro Nº 4.1.2.2.Evolución <strong>de</strong> <strong>la</strong>s Emisiones <strong>de</strong> CH4Esc<strong>en</strong>ario <strong>de</strong> Mitigación(10 3 Tn)Tipo Ambito Modo Medio1997 2000 2004 2008 2012Acumu<strong>la</strong>do1998-2012Autos particu<strong>la</strong>res 8,28 12,50 15,74 26,82 41,41 244,86CarreteroTaxi 3,70 5,47 8,17 9,12 9,70 101,80Colectivos 0,24 0,42 2,80 7,20 10,75 45,11UrbanoSub Total Carretero 12,22 18,39 26,71 43,15 61,86 391,77Ferrocarril 0,00 0,00 0,00 0,00 0,00 0,06Rodoviario Subterráneo 0,00 0,00 0,00 0,00 0,00 0,00PasajerosSub Total Rodoviario 0,00 0,00 0,00 0,00 0,00 0,06SUB TOTAL URBANO12,23 18,39 26,71 43,15 61,87 391,83Carretero Omnibus 0,21 0,32 0,42 0,63 0,93 6,03Rodoviario Ferrocarril 0,00 0,00 0,00 0,00 0,00 0,02InterurbanoAéreo Avión 0,20 0,25 0,30 0,34 0,38 4,10SUB TOTAL INTERURBANO0,41 0,56 0,72 0,97 1,32 10,15TOTAL PASAJEROS 12,64 18,96 27,43 44,12 63,18 401,98UrbanoCarretero Utilitarios m<strong>en</strong>os <strong>de</strong> 2 Tn 23,18 33,47 56,80 81,49 102,85 751,28SUB TOTAL URBANO23,18 33,47 56,80 81,49 102,85 751,28Carretero Camiones <strong>de</strong> más <strong>de</strong> 2 Tn 1,25 1,36 1,96 3,28 4,59 29,87Rodoviario Ferrocarril 0,03 0,04 0,05 0,06 0,07 0,66CargasBarcos 4,97 5,12 5,61 6,05 6,58 0,00InterurbanoFluvial Barcazas (Remolcadores) 0,01 0,02 0,02 0,02 0,02 0,23Sub Total Fluvial 4,98 5,13 5,62 6,06 6,60 0,23SUB TOTAL INTERURBANO6,26 6,53 7,62 9,40 11,26 30,77TOTAL CARGAS29,44 40,00 64,42 90,89 114,11 782,05TOTAL TRANSPORTE 42,08 58,96 91,85 135,01 177,29 1.184,03109