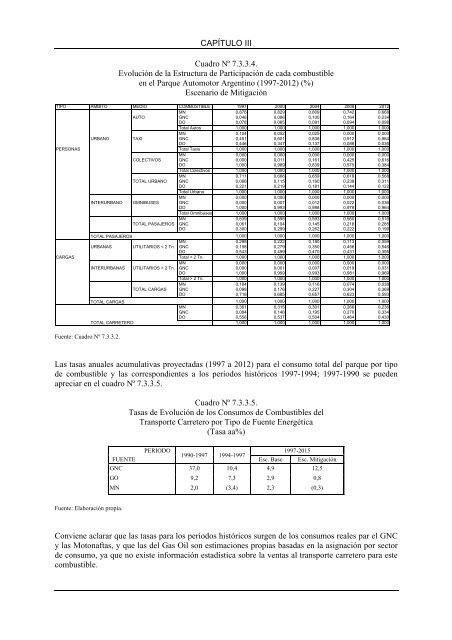
Fu<strong>en</strong>te: Cuadro Nº 7.3.3.2.CAPÍTULO IIICuadro Nº 7.3.3.4.Evolución <strong>de</strong> <strong>la</strong> Estructura <strong>de</strong> Participación <strong>de</strong> cada combustible<strong>en</strong> <strong>el</strong> Parque Automotor Arg<strong>en</strong>tino (1997-2012) (%)Esc<strong>en</strong>ario <strong>de</strong> MitigaciónTIPO AMBITO MEDIO COMBUSTIBLE 1997 2000 2004 2008 2012MN 0,876 0,829 0,809 0,742 0,668AUTO GNC 0,046 0,086 0,100 0,164 0,234DO 0,078 0,085 0,091 0,094 0,098Total Autos 1,000 1,000 1,000 1,000 1,000MN 0,104 0,052 0,025 0,000 0,000URBANO TAXI GNC 0,451 0,601 0,838 0,912 0,964DO 0,446 0,347 0,137 0,088 0,036PERSONAS Total Taxis 1,000 1,000 1,000 1,000 1,000MN 0,000 0,000 0,000 0,000 0,000COLECTIVOS GNC 0,000 0,011 0,161 0,425 0,616DO 1,000 0,989 0,839 0,575 0,384Total Colectivos 1,000 1,000 1,000 1,000 1,000MN 0,711 0,666 0,659 0,618 0,568TOTAL URBANO GNC 0,068 0,115 0,160 0,238 0,311DO 0,221 0,219 0,181 0,144 0,122Total Urbano 1,000 1,000 1,000 1,000 1,000MN 0,000 0,000 0,000 0,000 0,000INTERURBANO OMNIBUSES GNC 0,000 0,007 0,012 0,022 0,036DO 1,000 0,993 0,988 0,978 0,964Total Omnibuses 1,000 1,000 1,000 1,000 1,000MN 0,639 0,598 0,593 0,560 0,516TOTAL PASAJEROS GNC 0,061 0,104 0,145 0,218 0,285DO 0,300 0,299 0,262 0,222 0,199TOTAL PASAJEROS1,000 1,000 1,000 1,000 1,000MN 0,298 0,222 0,180 0,113 0,059URBANAS UTILITARIOS < 2 Tn. GNC 0,158 0,279 0,350 0,456 0,546DO 0,543 0,499 0,470 0,431 0,395CARGAS Total < 2 Tn. 1,000 1,000 1,000 1,000 1,000MN 0,000 0,000 0,000 0,000 0,000INTERURBANAS UTILITARIOS > 2 Tn. GNC 0,000 0,001 0,007 0,019 0,031DO 1,000 0,999 0,993 0,981 0,969Total > 2 Tn. 1,000 1,000 1,000 1,000 1,000MN 0,184 0,139 0,116 0,074 0,038TOTAL CARGAS GNC 0,098 0,176 0,227 0,304 0,369DO 0,718 0,685 0,657 0,623 0,593TOTAL CARGAS1,000 1,000 1,000 1,000 1,000MN 0,361 0,315 0,301 0,266 0,236GNC 0,084 0,148 0,195 0,270 0,334DO 0,556 0,537 0,504 0,464 0,430TOTAL CARRETERO 1,000 1,000 1,000 1,000 1,000Las tasas anuales acumu<strong>la</strong>tivas proyectadas (1997 a 2012) para <strong>el</strong> consumo total <strong>de</strong>l parque por tipo<strong>de</strong> combustible y <strong>la</strong>s correspondi<strong>en</strong>tes a los períodos históricos 1997-1994; 1997-1990 se pue<strong>de</strong>napreciar <strong>en</strong> <strong>el</strong> cuadro Nº 7.3.3.5.Cuadro Nº 7.3.3.5.Tasas <strong>de</strong> Evolución <strong>de</strong> los Consumos <strong>de</strong> Combustibles <strong>de</strong>lTransporte Carretero por Tipo <strong>de</strong> Fu<strong>en</strong>te Energética(Tasa aa%)PERIODO 1997-20151990-1997 1994-1997FUENTEEsc. Base Esc. MitigaciónGNC 37,0 10,4 4,9 12,5GO 9,2 7,3 2,9 0,8MN 2,0 (3,4) 2,3 (0,3)Fu<strong>en</strong>te: E<strong>la</strong>boración propia.Convi<strong>en</strong>e ac<strong>la</strong>rar que <strong>la</strong>s tasas para los períodos históricos surg<strong>en</strong> <strong>de</strong> los consumos reales par <strong>el</strong> GNCy <strong>la</strong>s Motonaftas, y que <strong>la</strong>s <strong>de</strong>l Gas Oil son estimaciones propias basadas <strong>en</strong> <strong>la</strong> asignación por <strong>sector</strong><strong>de</strong> consumo, ya que no existe información estadística sobre <strong>la</strong> v<strong>en</strong>tas al <strong>transporte</strong> carretero para estecombustible.
CAPÍTULO IIIDe todas maneras pue<strong>de</strong> apreciarse que no resultaría posible mant<strong>en</strong>er los niv<strong>el</strong>es <strong>de</strong> expansión <strong>de</strong>consumos <strong>de</strong> GNC que surg<strong>en</strong> <strong>de</strong>l período 1990-1997 y que <strong>el</strong> Esc<strong>en</strong>ario <strong>de</strong> Mitigación supera <strong>el</strong> crecimi<strong>en</strong>toverificado <strong>en</strong> <strong>el</strong> corto p<strong>la</strong>zo 1994-1997.El consumo <strong>de</strong> Motonaftas <strong>en</strong> <strong>el</strong> Esc<strong>en</strong>ario Base se recupera respecto <strong>de</strong>l período histórico reci<strong>en</strong>te yvu<strong>el</strong>ve a <strong>la</strong>s tasas <strong>de</strong> crecimi<strong>en</strong>to verificadas <strong>en</strong>tre 1990 y 1997. Esto se <strong>de</strong>be exclusivam<strong>en</strong>te al mant<strong>en</strong>imi<strong>en</strong>to<strong>de</strong> este combustible <strong>en</strong> los automóviles particu<strong>la</strong>res.También <strong>en</strong> este Esc<strong>en</strong>ario si bi<strong>en</strong> los motores dies<strong>el</strong> continúan p<strong>en</strong>etrando <strong>en</strong> los medios don<strong>de</strong> compit<strong>en</strong>con <strong>la</strong>s motonaftas y <strong>el</strong> GNC, su ritmo <strong>de</strong> crecimi<strong>en</strong>to se atempera significativam<strong>en</strong>te respecto<strong>de</strong> <strong>la</strong> historia.En cambio <strong>la</strong>s Motonaftas <strong>en</strong> <strong>el</strong> Esc<strong>en</strong>ario <strong>de</strong> Mitigación ca<strong>en</strong>, incl<strong>uso</strong> <strong>en</strong> valores absolutos, comoconsecu<strong>en</strong>cia <strong>de</strong> <strong>la</strong> política asumida respecto <strong>de</strong>l GNC.En <strong>el</strong> Cuadro Nº 7.3.3.6. como síntesis <strong>de</strong> los resultados <strong>en</strong> este aspecto, se aprecian <strong>la</strong>s tasas <strong>de</strong> evolución<strong>de</strong> los consumos <strong>de</strong> combustibles para cada medio y para ambos Esc<strong>en</strong>arios.En ambos esc<strong>en</strong>arios resultan atemperadas <strong>la</strong>s tasas <strong>de</strong> crecimi<strong>en</strong>to <strong>de</strong>l gas oil, muy especialm<strong>en</strong>te <strong>en</strong>le Esc<strong>en</strong>ario Alternativo, coher<strong>en</strong>tem<strong>en</strong>te con <strong>la</strong>s hipótesis establecidas al e<strong>la</strong>borar <strong>la</strong>s proyecciones<strong>de</strong> estructura <strong>de</strong> los parques.A niv<strong>el</strong> <strong>de</strong> cada medio <strong>de</strong> <strong>transporte</strong> pue<strong>de</strong> apreciarse: que <strong>el</strong> mercado <strong>de</strong> Motonaftas, prácticam<strong>en</strong>tequeda circunscripto a los Autos Particu<strong>la</strong>res; que <strong>el</strong> Gas Oil continúa dominando <strong>el</strong> <strong>transporte</strong> <strong>de</strong> cargasy <strong>de</strong> personas <strong>en</strong> media y especialm<strong>en</strong>te <strong>la</strong>rga distancia (camiones <strong>de</strong> más <strong>de</strong> 2 Tn y ómnibuses) yque <strong>el</strong> GNC <strong>en</strong> <strong>el</strong> Esc<strong>en</strong>ario <strong>de</strong> Mitigación, capturaría totalm<strong>en</strong>te <strong>el</strong> mercado <strong>de</strong> “taxis” y bu<strong>en</strong>a parte<strong>de</strong>l <strong>de</strong> colectivos y cargas <strong>de</strong> m<strong>en</strong>os <strong>de</strong> 2 Tn.Cuadro Nº 7.3.3.6.Comparación <strong>de</strong> <strong>la</strong>s tasas <strong>de</strong> evolución <strong>de</strong> los consumos<strong>de</strong> combustibles <strong>en</strong>tre ambos Esc<strong>en</strong>ariosTasas 2012-1997 (% aa)MEDIOFUENTEMITIGA-BASECIÓNDO 6,2 5,1AUTOS GNC 6,1 15,4MN 3,3 1,6DO 2,9 -14,0PERSONASTAXIS GNC 2,1 6,8MN (+)COLECTIVOSDO 0,7 -16,4GNC (++) >100OMNIBUSDO 2,5 2,1GNC (++) >100DO 2,9 0,6UTILITARIOS < 2 TN GNC 4,9 11,5CARGASMN -0,3 -8,0DO 1,8 1,4UTILITARIOS > 2 TN GNC >100TOTAL DO 2,9 0,8TOTAL GNC 4,9 12,5TOTAL MN 2,3 -0,3(+) En <strong>el</strong> año 2012 <strong>de</strong>saparec<strong>en</strong>.(++) En <strong>el</strong> año 1997 no existía este consumo.Fu<strong>en</strong>te: E<strong>la</strong>boración propia.Los consumos <strong>de</strong> GNC <strong>en</strong> Omnibuses <strong>en</strong> <strong>el</strong> Esc<strong>en</strong>ario Alternativo se refier<strong>en</strong> so<strong>la</strong>m<strong>en</strong>te a los <strong>de</strong> cortay media distancia por lo que su participación es muy reducida (solo <strong>el</strong> 3,6% <strong>en</strong> <strong>el</strong> año 2012).