uso eficiente de la energÃa en el sector transporte - Ãreas de Gestión
uso eficiente de la energÃa en el sector transporte - Ãreas de Gestión
uso eficiente de la energÃa en el sector transporte - Ãreas de Gestión

You also want an ePaper? Increase the reach of your titles
YUMPU automatically turns print PDFs into web optimized ePapers that Google loves.
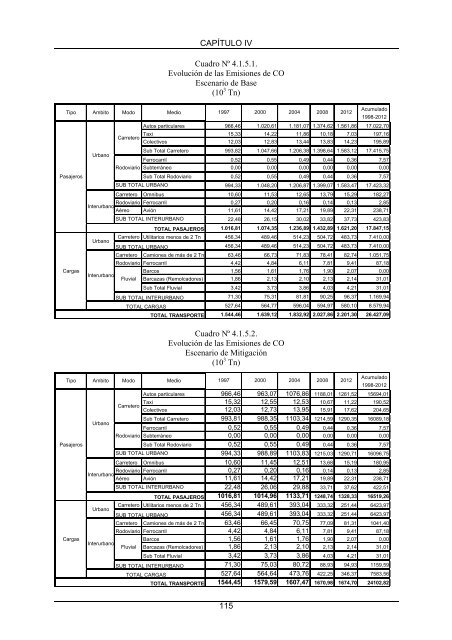
CAPÍTULO IVCuadro Nº 4.1.5.1.Evolución <strong>de</strong> <strong>la</strong>s Emisiones <strong>de</strong> COEsc<strong>en</strong>ario <strong>de</strong> Base(10 3 Tn)Tipo Ambito Modo Medio 1997 2000 2004 2008 2012Acumu<strong>la</strong>do1998-2012Autos particu<strong>la</strong>res 966,46 1.020,61 1.181,07 1.374,62 1.561,86 17.022,70CarreteroTaxi 15,33 14,22 11,86 10,18 7,03 197,16Colectivos 12,03 12,83 13,44 13,83 14,23 195,89UrbanoSub Total Carretero 993,82 1.047,66 1.206,38 1.398,64 1.583,12 17.415,75Ferrocarril 0,52 0,55 0,49 0,44 0,36 7,57Rodoviario Subterráneo 0,00 0,00 0,00 0,00 0,00 0,00PasajerosSub Total Rodoviario 0,52 0,55 0,49 0,44 0,36 7,57SUB TOTAL URBANO994,33 1.048,20 1.206,87 1.399,07 1.583,47 17.423,32Carretero Omnibus 10,60 11,53 12,65 13,79 15,29 182,27Rodoviario Ferrocarril 0,27 0,20 0,16 0,14 0,13 2,85InterurbanoAéreo Avión 11,61 14,42 17,21 19,89 22,31 238,71SUB TOTAL INTERURBANO22,48 26,15 30,02 33,82 37,73 423,83TOTAL PASAJEROS 1.016,81 1.074,35 1.236,89 1.432,89 1.621,20 17.847,15UrbanoCarretero Utilitarios m<strong>en</strong>os <strong>de</strong> 2 Tn 456,34 489,46 514,23 504,72 483,73 7.410,00SUB TOTAL URBANO456,34 489,46 514,23 504,72 483,73 7.410,00Carretero Camiones <strong>de</strong> más <strong>de</strong> 2 Tn 63,46 66,73 71,83 78,41 82,74 1.051,75Rodoviario Ferrocarril 4,42 4,84 6,11 7,81 9,41 87,18CargasBarcos 1,56 1,61 1,76 1,90 2,07 0,00InterurbanoFluvial Barcazas (Remolcadores) 1,86 2,13 2,10 2,13 2,14 31,01Sub Total Fluvial 3,42 3,73 3,86 4,03 4,21 31,01SUB TOTAL INTERURBANO71,30 75,31 81,81 90,25 96,37 1.169,94TOTAL CARGAS527,64 564,77 596,04 594,97 580,10 8.579,94TOTAL TRANSPORTE 1.544,46 1.639,12 1.832,92 2.027,86 2.201,30 26.427,09Tipo Ambito Modo MedioPasajerosCargasUrbanoCuadro Nº 4.1.5.2.Evolución <strong>de</strong> <strong>la</strong>s Emisiones <strong>de</strong> COEsc<strong>en</strong>ario <strong>de</strong> Mitigación(10 3 Tn)Acumu<strong>la</strong>do1998-2012Autos particu<strong>la</strong>res 966,46 963,07 1076,86 1188,01 1261,52 15694,01Taxi 15,32 12,55 12,53 10,67 11,22 190,52Colectivos 12,03 12,73 13,95 15,91 17,62 204,65Sub Total Carretero 993,81 988,35 1103,34 1214,59 1290,35 16089,18Ferrocarril 0,52 0,55 0,49 0,44 0,36 7,57Rodoviario Subterráneo 0,00 0,00 0,00 0,00 0,00 0,00Sub Total Rodoviario 0,52 0,55 0,49 0,44 0,36 7,57SUB TOTAL URBANO994,33 988,89 1103,83 1215,03 1290,71 16096,75Carretero Omnibus 10,60 11,45 12,51 13,68 15,19 180,95Rodoviario Ferrocarril 0,27 0,20 0,16 0,14 0,13 2,85InterurbanoAéreo Avión 11,61 14,42 17,21 19,89 22,31 238,71SUB TOTAL INTERURBANO22,48 26,06 29,88 33,71 37,62 422,51TOTAL PASAJEROS 1016,81 1014,96 1133,71 1248,74 1328,33 16519,26UrbanoInterurbanoCarreteroCarretero Utilitarios m<strong>en</strong>os <strong>de</strong> 2 Tn 456,34 489,61 393,04 333,32 251,44 6423,97SUB TOTAL URBANO456,34 489,61 393,04 333,32 251,44 6423,97Carretero Camiones <strong>de</strong> más <strong>de</strong> 2 Tn 63,46 66,45 70,75 77,09 81,31 1041,40Rodoviario Ferrocarril 4,42 4,84 6,11 7,81 9,41 87,18Fluvial1997 2000 2004 2008Barcos 1,56 1,61 1,76 1,90 2,07 0,00Barcazas (Remolcadores) 1,86 2,13 2,10 2,13 2,14 31,01Sub Total Fluvial 3,42 3,73 3,86 4,03 4,21 31,01SUB TOTAL INTERURBANO71,30 75,03 80,72 88,93 94,93 1159,59TOTAL CARGAS527,64 564,64 473,76 422,25 346,37 7583,56TOTAL TRANSPORTE 1544,45 1579,59 1607,47 1670,98 1674,70 24102,822012115