Relazione semestrale
Relazione semestrale
Relazione semestrale
- No tags were found...

You also want an ePaper? Increase the reach of your titles
YUMPU automatically turns print PDFs into web optimized ePapers that Google loves.
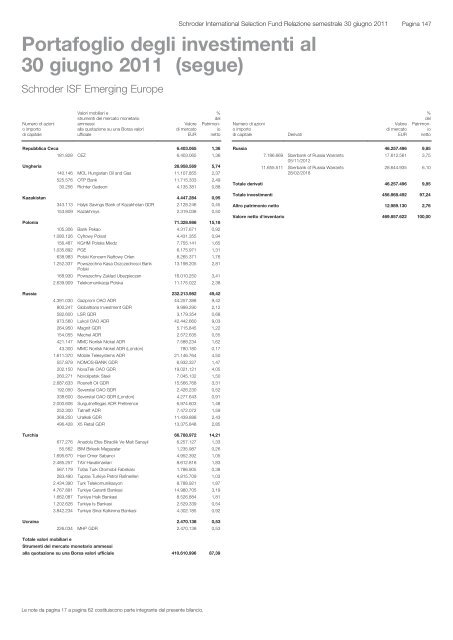
Schroder International Selection Fund <strong>Relazione</strong> <strong>semestrale</strong> 30 giugno 2011Portafoglio degli investimenti al30 giugno 2011 (segue)Pagina 147Schroder ISF Emerging EuropeSchroder ISF Emerging Europe (segue)Numero di azionio importodi capitaleValori mobiliari estrumenti del mercato monetarioammessialla quotazione su una Borsa valoriufficialeValoredi mercatoEUR%delPatrimonionettoNumero di azionio importodi capitaleDerivatiValoredi mercatoEUR%delPatrimonionettoRepubblica Ceca 6.403.065 1,36181.828 CEZ 6.403.065 1,36Ungheria 26.958.569 5,74140.146 MOL Hungarian Oil and Gas 11.107.855 2,37525.576 OTP Bank 11.715.333 2,4930.256 Richter Gedeon 4.135.381 0,88Kazakistan 4.447.284 0,95343.113 Halyk Savings Bank of Kazakhstan GDR 2.128.246 0,45153.809 Kazakhmys 2.319.038 0,50Polonia 71.328.986 15,18105.306 Bank Pekao 4.317.671 0,921.080.126 Cyfrowy Polsat 4.431.355 0,94156.487 KGHM Polska Miedz 7.755.141 1,651.035.892 PGE 6.175.971 1,31638.983 Polski Koncern Naftowy Orlen 8.265.371 1,761.252.337 Powszechna Kasa Oszczednosci Bank13.198.205 2,81Polski168.930 Powszechny Zaklad Ubezpieczen 16.010.250 3,412.639.909 Telekomunikacja Polska 11.175.022 2,38Russia 46.257.496 9,857.186.669 Sberbank of Russia Warrants17.612.561 3,7505/11/201211.655.511 Sberbank of Russia Warrants28/02/201828.644.935 6,10Totale derivati 46.257.496 9,85Totale investimenti 456.868.492 97,24Altro patrimonio netto 12.989.130 2,76Valore netto d'inventario 469.857.622 100,00Russia 232.213.982 49,424.391.030 Gazprom OAO ADR 44.257.388 9,42800.247 Globaltrans Investment GDR 9.999.290 2,12582.600 LSR GDR 3.179.354 0,68973.560 Lukoil OAO ADR 42.442.660 9,03264.950 Magnit GDR 5.715.845 1,22154.055 Mechel ADR 2.572.635 0,55421.147 MMC Norilsk Nickel ADR 7.588.234 1,6243.300 MMC Norilsk Nickel ADR (London) 780.180 0,171.611.370 Mobile Telesystems ADR 21.146.764 4,50557.879 NOMOS-BANK GDR 6.932.327 1,47202.150 NovaTek OAO GDR 19.021.121 4,05260.271 Novolipetsk Steel 7.045.132 1,502.687.633 Rosneft Oil GDR 15.566.768 3,31192.050 Severstal OAO GDR 2.426.230 0,52338.600 Severstal OAO GDR (London) 4.277.643 0,912.000.606 Surgutneftegas ADR Preference 6.974.603 1,48252.300 Tatneft ADR 7.472.072 1,59368.250 Uralkali GDR 11.439.888 2,43496.428 X5 Retail GDR 13.375.848 2,85Turchia 66.788.972 14,21677.276 Anadolu Efes Biracilik Ve Malt Sanayii 6.257.127 1,3355.562 BIM Birlesik Magazalar 1.235.987 0,261.695.670 Haci Omer Sabanci 4.952.392 1,052.485.257 TAV Havalimanlari 8.612.818 1,83567.179 Tofas Turk Otomobil Fabrikasi 1.786.905 0,38283.490 Tupras Turkiye Petrol Rafinerileri 4.815.709 1,032.434.390 Turk Telekomunikasyon 8.788.921 1,874.767.891 Turkiye Garanti Bankasi 14.980.705 3,191.662.087 Turkiye Halk Bankasi 8.526.884 1,811.202.626 Turkiye Is Bankasi 2.529.339 0,543.842.234 Turkiye Sinai Kalkinma Bankasi 4.302.185 0,92Ucraina 2.470.138 0,53226.034 MHP GDR 2.470.138 0,53Totale valori mobiliari eStrumenti del mercato monetario ammessialla quotazione su una Borsa valori ufficiale 410.610.996 87,39Le note da pagina 17 a pagina 62 costituiscono parte integrante del presente bilancio.