Relazione semestrale
Relazione semestrale
Relazione semestrale
- No tags were found...

You also want an ePaper? Increase the reach of your titles
YUMPU automatically turns print PDFs into web optimized ePapers that Google loves.
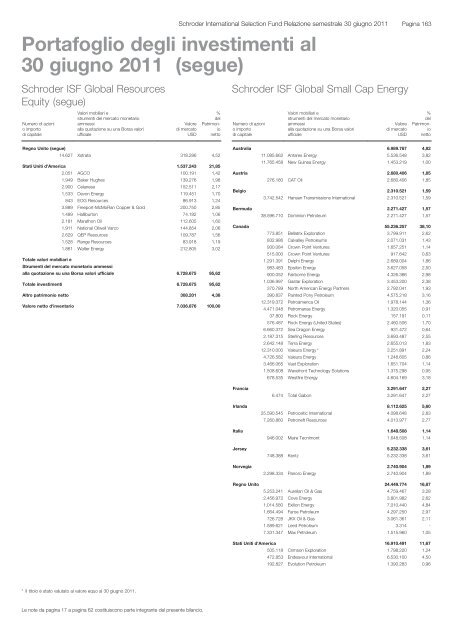
Schroder International Selection Fund <strong>Relazione</strong> <strong>semestrale</strong> 30 giugno 2011Portafoglio degli investimenti al30 giugno 2011 (segue)Pagina 163Schroder ISF Global ResourcesEquity (segue)Numero di azionio importodi capitaleValori mobiliari estrumenti del mercato monetarioammessialla quotazione su una Borsa valoriufficialeValoredi mercatoUSD%delPatrimonionettoSchroder ISF Global Small Cap EnergyNumero di azionio importodi capitaleValori mobiliari estrumenti del mercato monetarioammessialla quotazione su una Borsa valoriufficialeValoredi mercatoUSD%delPatrimonionettoRegno Unito (segue)14.627 Xstrata 318.286 4,52Stati Uniti d'America 1.537.243 21,852.051 AGCO 100.191 1,421.949 Baker Hughes 139.276 1,982.900 Celanese 152.511 2,171.533 Devon Energy 119.451 1,70843 EOG Resources 86.913 1,243.889 Freeport-McMoRan Copper & Gold 200.750 2,851.489 Halliburton 74.182 1,062.181 Marathon Oil 112.605 1,601.911 National Oilwell Varco 144.854 2,062.629 QEP Resources 109.787 1,561.528 Range Resources 83.918 1,191.861 Walter Energy 212.805 3,02Totale valori mobiliari eStrumenti del mercato monetario ammessialla quotazione su una Borsa valori ufficiale 6.728.675 95,62Totale investimenti 6.728.675 95,62Altro patrimonio netto 308.201 4,38Valore netto d'inventario 7.036.876 100,00Australia 6.989.767 4,8211.085.662 Antares Energy 5.536.548 3,8211.765.458 New Guinea Energy 1.453.219 1,00Austria 2.680.406 1,85276.180 CAT Oil 2.680.406 1,85Belgio 2.310.521 1,593.742.542 Hansen Transmissions International 2.310.521 1,59Bermuda 2.271.427 1,5738.596.710 Dominion Petroleum 2.271.427 1,57Canada 55.236.257 38,10773.851 Bellatrix Exploration 3.799.911 2,62832.986 Calvalley Petroleums 2.071.031 1,43930.084 Crown Point Ventures 1.657.251 1,14515.000 Crown Point Ventures 917.642 0,631.291.391 Delphi Energy 2.689.004 1,86983.483 Epsilon Energy 3.627.058 2,50900.052 Fairborne Energy 4.326.366 2,981.036.997 Gastar Exploration 3.453.200 2,38370.789 North American Energy Partners 2.792.041 1,93390.837 Painted Pony Petroleum 4.575.218 3,1612.319.372 Petroamerica Oil 1.978.144 1,364.471.048 Petromanas Energy 1.320.055 0,9137.800 Rock Energy 157.191 0,11576.487 Rock Energy (United States) 2.460.506 1,706.660.372 Sea Dragon Energy 931.472 0,642.187.315 Sterling Resources 3.693.487 2,552.642.148 Terra Energy 2.655.013 1,8312.310.000 Valeura Energy * 3.251.891 2,244.726.582 Valeura Energy 1.248.605 0,863.466.065 Vast Exploration 1.651.704 1,141.508.608 Wavefront Technology Solutions 1.375.298 0,95678.535 Westfire Energy 4.604.169 3,18Francia 3.291.647 2,276.474 Total Gabon 3.291.647 2,27Irlanda 8.112.625 5,6025.590.545 Petroceltic International 4.098.648 2,837.260.860 Petroneft Resources 4.013.977 2,77Italia 1.648.508 1,14946.002 Maire Tecnimont 1.648.508 1,14Jersey 5.232.338 3,61748.388 Kentz 5.232.338 3,61Norvegia 2.740.904 1,892.298.334 Panoro Energy 2.740.904 1,89Regno Unito 24.449.774 16,875.253.241 Aurelian Oil & Gas 4.759.467 3,282.456.972 Cove Energy 3.801.982 2,621.014.580 Exillon Energy 7.010.440 4,841.664.494 Faroe Petroleum 4.297.250 2,97726.728 JKX Oil & Gas 3.061.361 2,111.589.621 Leed Petroleum 3.314 -7.331.347 Max Petroleum 1.515.960 1,05Stati Uniti d'America 16.910.491 11,67505.118 Crimson Exploration 1.798.220 1,24472.853 Endeavour International 6.530.100 4,50192.827 Evolution Petroleum 1.390.283 0,96* Il titolo è stato valutato al valore equo al 30 giugno 2011.Le note da pagina 17 a pagina 62 costituiscono parte integrante del presente bilancio.