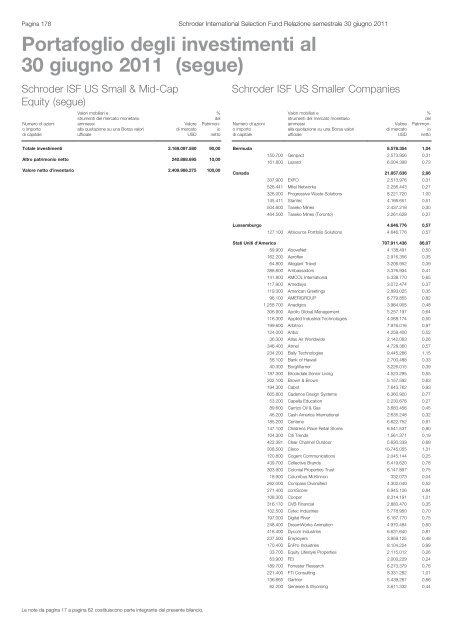
Pagina 178 Schroder International Selection Fund <strong>Relazione</strong> <strong>semestrale</strong> 30 giugno 2011Portafoglio degli investimenti al30 giugno 2011 (segue)Schroder ISF US Small & Mid-CapEquity (segue)Numero di azionio importodi capitaleValori mobiliari estrumenti del mercato monetarioammessialla quotazione su una Borsa valoriufficialeValoredi mercatoUSD%delPatrimonionettoSchroder ISF US Smaller CompaniesNumero di azionio importodi capitaleValori mobiliari estrumenti del mercato monetarioammessialla quotazione su una Borsa valoriufficialeValoredi mercatoUSD%delPatrimonionettoTotale investimenti 2.169.097.580 90,00Altro patrimonio netto 240.888.695 10,00Valore netto d'inventario 2.409.986.275 100,00Bermuda 8.578.354 1,04150.700 Genpact 2.573.956 0,31161.800 Lazard 6.004.398 0,73Canada 21.857.636 2,66337.900 EXFO 2.513.976 0,31528.441 Mitel Networks 2.256.443 0,27326.000 Progressive Waste Solutions 8.221.720 1,00145.411 Stantec 4.166.651 0,51504.600 Taseko Mines 2.437.218 0,30464.500 Taseko Mines (Toronto) 2.261.628 0,27Lussemburgo 4.646.776 0,57127.100 Altisource Portfolio Solutions 4.646.776 0,57Stati Uniti d'America 707.911.436 86,0759.900 AboveNet 4.138.491 0,50162.200 Aeroflex 2.916.356 0,3564.800 Allegiant Travel 3.206.952 0,39388.600 Ambassadors 3.376.934 0,41141.800 AMCOL International 5.338.770 0,65117.900 Amedisys 3.072.474 0,37119.300 American Greetings 2.893.025 0,3596.100 AMERIGROUP 6.779.855 0,821.258.700 Anadigics 3.964.905 0,48306.900 Apollo Global Management 5.257.197 0,64116.300 Applied Industrial Technologies 4.068.174 0,50199.600 Arbitron 7.976.016 0,97124.000 Ariba 4.259.400 0,5236.300 Atlas Air Worldwide 2.142.063 0,26346.400 Atmel 4.728.360 0,57234.200 Bally Technologies 9.445.286 1,1558.100 Bank of Hawaii 2.700.488 0,3340.300 BorgWarner 3.226.015 0,39187.300 Brookdale Senior Living 4.523.295 0,55202.100 Brown & Brown 5.157.592 0,63194.300 Cabot 7.643.762 0,93605.800 Cadence Design Systems 6.360.900 0,7753.200 Capella Education 2.230.676 0,2789.600 Carrizo Oil & Gas 3.683.456 0,4546.200 Cash America International 2.635.248 0,32185.200 Centene 6.622.752 0,81147.100 Childrens Place Retail Stores 6.541.537 0,80104.300 Citi Trends 1.561.371 0,19422.381 Clear Channel Outdoor 5.630.339 0,68308.500 Cleco 10.745.055 1,31120.800 Cogent Communications 2.045.144 0,25439.700 Collective Brands 6.419.620 0,78303.900 Colonial Properties Trust 6.147.897 0,7518.900 Columbus McKinnon 332.073 0,04262.000 Compass Diversified 4.302.040 0,52271.400 comScore 6.945.126 0,84108.300 Cooper 8.314.191 1,01316.170 CVB Financial 2.883.470 0,35102.500 Cytec Industries 5.778.950 0,70197.000 Digital River 6.187.770 0,75248.400 DreamWorks Animation 4.970.484 0,60418.400 Dycom Industries 6.631.640 0,81237.500 Employers 3.959.125 0,48170.400 EnPro Industries 8.104.224 0,9933.700 Equity Lifestyle Properties 2.115.012 0,2653.900 FEI 2.000.229 0,24189.700 Forrester Research 6.273.379 0,76221.400 FTI Consulting 8.331.282 1,01136.665 Gartner 5.439.267 0,6662.200 Genesee & Wyoming 3.611.332 0,44Le note da pagina 17 a pagina 62 costituiscono parte integrante del presente bilancio.
Schroder International Selection Fund <strong>Relazione</strong> <strong>semestrale</strong> 30 giugno 2011Portafoglio degli investimenti al30 giugno 2011 (segue)Pagina 179Schroder ISF US SmallerCompanies (segue)Schroder ISF US SmallerCompanies (segue)Numero di azionio importodi capitaleValori mobiliari estrumenti del mercato monetarioammessialla quotazione su una Borsa valoriufficialeValoredi mercatoUSD%delPatrimonionettoNumero di azionio importodi capitaleValori mobiliari estrumenti del mercato monetarioammessialla quotazione su una Borsa valoriufficialeValoredi mercatoUSD%delPatrimonionettoStati Uniti d'America (segue)245.000 Gentiva Health Services 4.988.200 0,61384.900 GrafTech International 7.640.265 0,93354.400 Graham Packaging 8.945.056 1,09127.900 Haemonetics 8.167.694 0,99150.500 Harman International Industries 6.751.430 0,82806.800 Hawaiian 4.727.848 0,57100.381 Health Care REIT 5.304.132 0,64278.200 Healthcare Services 4.543.006 0,55651.300 Helix Energy Solutions 10.726.911 1,3047.500 Hittite Microwave 2.858.075 0,3526.900 HMS 2.040.903 0,25112.100 Home Properties 6.738.331 0,8278.400 Iberiabank 4.518.192 0,55142.000 IDACORP 5.573.500 0,68132.606 IDEX 5.968.596 0,7344.500 Infinity Property & Casualty 2.440.380 0,30165.200 Innophos 8.045.240 0,9886.100 Insulet 1.882.146 0,23820.100 Integrated Device Technology 6.306.569 0,7762.300 IPC The Hospitalist 2.884.490 0,35160.400 Jarden 5.447.184 0,6692.300 Kaiser Aluminum 4.978.662 0,61545.400 KapStone Paper and Packaging 8.993.646 1,09239.300 Kenexa 5.764.737 0,7096.696 Kindred Healthcare 2.089.601 0,25364.000 Knight Capital 3.993.080 0,4971.400 Lamar Advertising 1.962.786 0,241.273.603 Lexicon Pharmaceuticals 2.101.445 0,26113.400 Lithia Motors 2.204.496 0,27230.300 LKQ 6.040.769 0,73175.800 Masimo 5.210.712 0,6396.700 Matthews International 3.830.287 0,47112.500 MB Financial 2.121.750 0,2666.600 Medicis Pharmaceutical 2.524.806 0,31169.700 Men's Wearhouse 5.727.375 0,7069.500 Meredith 2.151.025 0,26271.300 Methode Electronics 2.875.780 0,3579.600 Michael Baker 1.663.640 0,20283.300 Monster Worldwide 4.116.349 0,50218.000 Nash Finch 7.660.520 0,93193.600 Netscout Systems 4.036.560 0,49201.500 NorthWestern 6.629.350 0,81745.200 Ocwen Financial 9.449.136 1,15321.800 Old National Bancorp 3.385.336 0,41186.700 Olin 4.215.686 0,5174.000 Onyx Pharmaceuticals 2.687.680 0,33309.700 Orion Marine 2.942.150 0,3648.400 Pantry 904.112 0,11456.052 Parametric Technology 10.735.464 1,31227.100 Parexel International 5.273.262 0,64240.800 Pebblebrook Hotel Trust 4.741.352 0,58196.600 Penn Virginia 2.593.154 0,3294.700 Petroleum Development 2.829.636 0,34305.100 Petroquest Energy 2.096.037 0,25424.300 Pike Electric 3.759.298 0,46438.187 Pinnacle Entertainment 6.415.058 0,78514.600 Power-One 4.121.946 0,50220.400 QLogic 3.464.688 0,4265.400 Quaker Chemical 2.748.108 0,33214.200 Redwood Trust 3.208.716 0,39156.354 Reinsurance Group of America 9.498.505 1,15359.900 Rent-A-Center 10.915.767 1,3365.300 RLI 4.007.461 0,49149.400 Rofin-Sinar Technologies 5.015.358 0,61Stati Uniti d'America (segue)116.800 Salix Pharmaceuticals 4.543.520 0,5570.600 Sanderson Farms 3.312.552 0,4083.900 Scansource 3.099.266 0,3881.400 Scholastic 2.133.494 0,26434.670 Scientific Games 4.433.634 0,54198.700 Seattle Genetics 4.190.583 0,5187.200 Shaw 2.601.176 0,32100.100 Silgan 4.056.052 0,49143.600 Simmons First National 3.630.208 0,4471.400 Sirona Dental Systems 3.796.338 0,4697.136 SM Energy 7.036.532 0,86136.300 Sonic Automotive 2.017.240 0,25121.900 Sonoco Products 4.310.384 0,52192.800 Standard Microsystems 5.168.968 0,63325.121 Standard Parking 5.201.936 0,63345.000 Stillwater Mining 7.493.400 0,91436.100 STR Holdings 6.371.421 0,78229.000 Superior Energy Services 8.427.200 1,0370.800 SVB Financial 4.212.600 0,51229.000 Team Health 5.122.730 0,6238.800 Techne 3.212.640 0,39110.600 Texas Capital Bancshares 2.841.314 0,35197.700 Thermon 2.368.446 0,29235.323 TNS 3.805.173 0,4671.735 Towers Watson & Co. 4.565.933 0,56238.200 Unisource Energy 8.863.422 1,08154.900 Valassis Communications 4.650.098 0,57105.700 Volcano 3.362.317 0,41403.700 Wabash National 3.657.522 0,44263.317 Waste Connections 8.347.149 1,00163.300 Websense 4.191.911 0,51667.200 Wendy's/Arby's 3.396.048 0,41151.600 West Pharmaceutical Services 6.555.184 0,80104.279 Westamerica Bancorporation 5.132.612 0,62Totale valori mobiliari eStrumenti del mercato monetario ammessialla quotazione su una Borsa valori ufficiale 742.994.202 90,34Totale investimenti 742.994.202 90,34Altro patrimonio netto 79.407.820 9,66Valore netto d'inventario 822.402.022 100,00Le note da pagina 17 a pagina 62 costituiscono parte integrante del presente bilancio.