Pagina 148 Schroder International Selection Fund <strong>Relazione</strong> <strong>semestrale</strong> 30 giugno 2011Portafoglio degli investimenti al30 giugno 2011 (segue)Schroder ISF Emerging MarketsSchroder ISF Emerging Markets (segue)Numero di azionio importodi capitaleValori mobiliari estrumenti del mercato monetarioammessialla quotazione su una Borsa valoriufficialeValoredi mercatoUSD%delPatrimonionettoNumero di azionio importodi capitaleValori mobiliari estrumenti del mercato monetarioammessialla quotazione su una Borsa valoriufficialeValoredi mercatoUSD%delPatrimonionettoBermuda 7.177.961 0,2983.011 Credicorp 7.177.961 0,29Brasile 384.059.863 15,371.860.192 Banco Bradesco ADR Preference 37.929.315 1,52988.800 BR Malls Participações 11.283.527 0,45561.261 BR Properties 6.375.919 0,26313.204 BRF - Brasil Foods ADR 5.383.977 0,22641.851 CCR 19.526.178 0,78264.600 Companhia de Bebidas das Americas8.853.516 0,35ADR Preference983.031 Companhia Energetica de Minas Gerais 20.211.117 0,81ADR Preference55.899 Companhia Energetica de Minas Gerais1.139.793 0,05Preference1.319.300 Gerdau ADR Preference 13.694.334 0,55503.900 Iochpe-Maxion 6.840.052 0,272.031.940 Itau Unibanco ADR Preference 47.588.035 1,91303.595 Itau Unibanco Preference 7.088.625 0,28399.500 Lojas Renner 15.476.426 0,62608.400 Magazine Luiza 6.411.609 0,263.839.600 PDG Realty Empreendimentos e22.079.979 0,88Participações20.484 Petroleo Brasileiro 338.530 0,01687.132 Petroleo Brasileiro ADR 22.847.139 0,911.027.749 Petroleo Brasileiro ADR Preference 31.140.795 1,25385.407 Telecomunicações de Sao Paulo ADR11.107.430 0,44Preference281.600 Ultrapar Participações ADR Preference 5.035.008 0,20622.000 Ultrapar Participações Preference 11.097.876 0,441.029.000 Vale ADR 32.485.530 1,301.397.602 Vale ADR Preference 40.125.153 1,61Cina 478.890.906 19,17522.500 Anhui Conch Cement 'H' 2.443.942 0,1043.000 Baidu ADR 5.915.940 0,241.023.000 Beijing Enterprises 5.330.521 0,218.377.000 Belle International 17.653.692 0,715.638.880 Changsha Zoomlion Heavy IndustryScience and Technology Development'H'10.738.516 0,4370.812.210 China Construction Bank 'H' 58.690.939 2,351.998.000 China Mengniu Dairy 6.726.668 0,275.050.500 China Mobile 46.727.233 1,878.478.000 China National Building Material 'H' 16.624.598 0,6717.758.000 China Petroleum & Chemical 'H' 17.867.303 0,725.943.000 China Shenhua Energy ‘H’ 28.332.365 1,1311.477.000 China Suntien Green Energy 'H' 3.008.581 0,1217.063.000 CNOOC 39.817.540 1,5968.603 CNOOC ADR 15.932.361 0,6411.572.000 Dongfeng Motor 'H' 21.858.933 0,8733.838.960 Franshion Properties China 8.609.648 0,34384.000 Golden Eagle Retail 974.051 0,0488.968.760 Industrial & Commercial Bank of China67.566.000 2,70'H'6.584.500 Parkson Retail 9.628.713 0,399.588.000 PetroChina ‘H’ 14.020.822 0,564.760.500 Ping An Insurance ‘H’ 49.152.051 1,9712.298.000 Poly Hong Kong Investments 8.091.101 0,32550.200 Tencent 14.931.990 0,602.275.960 ZTE 'H' 8.247.398 0,33Repubblica Ceca 9.159.723 0,37179.565 CEZ 9.159.723 0,37Egitto 6.504.205 0,261.931.118 Egyptian Financial Group-Hermes 6.504.205 0,26Hong Kong SAR 48.539.210 1,942.304.000 China Merchants International 8.896.725 0,36308.444 China Mobile ADR 14.302.548 0,578.568.000 China Overseas Land & Investment 18.364.483 0,733.576.000 China Resources Power 6.975.454 0,28Ungheria 76.625.844 3,071.753.971 Magyar Telekom Telecommunications 5.634.672 0,22242.630 MOL Hungarian Oil and Gas 27.856.563 1,121.083.251 OTP Bank 34.976.934 1,4041.203 Richter Gedeon 8.157.675 0,33India 78.442.055 3,14710.352 HDFC Bank 39.975.973 1,60179.894 Infosys 11.713.031 0,47227.726 Larsen & Toubro 9.291.170 0,37430.699 Reliance Industries 8.657.339 0,35644.921 Tata Steel 8.804.542 0,35Messico 48.403.667 1,94274.500 America Movil ADR 14.718.690 0,593.434.400 Compartamos 6.236.143 0,251.660.200 Corp GEO 3.819.495 0,151.268.600 Grupo Financiero Banorte 5.776.608 0,236.036.265 Wal-Mart de Mexico 17.852.731 0,72Perù 4.642.378 0,19122.200 Companhia de Minas Buenaventura ADR 4.642.378 0,19Polonia 42.534.943 1,701.073.336 Cyfrowy Polsat 6.378.687 0,2593.139 KGHM Polska Miedz 6.686.156 0,27361.961 Polski Koncern Naftowy Orlen 6.782.164 0,27798.601 Powszechna Kasa Oszczednosci Bank12.191.495 0,49Polski76.457 Powszechny Zaklad Ubezpieczen 10.496.441 0,42Qatar 14.414.695 0,58385.392 Industries Qatar 14.414.695 0,58Russia 191.592.988 7,675.617.800 Gazprom OAO ADR 82.019.880 3,29403.682 Globaltrans Investment GDR 7.306.644 0,29482.608 Lukoil OAO ADR 30.476.695 1,2280.890 Mechel ADR 1.956.729 0,08315.257 MMC Norilsk Nickel ADR 8.228.208 0,33501.700 Mobile Telesystems ADR 9.537.317 0,38108.585 NovaTek OAO GDR 14.800.136 0,5978.330 Novolipetsk Steel 3.071.319 0,12843.272 Rosneft Oil GDR 7.075.052 0,28328.750 Severstal OAO GDR 6.016.125 0,24201.700 Uralkali GDR 9.076.500 0,37308.183 X5 Retail GDR 12.028.383 0,48Sudafrica 119.122.485 4,7787.116 African Rainbow Minerals 2.432.147 0,108.604.040 FirstRand 25.144.041 1,0150.410 Foschini 644.804 0,03305.635 Gold Fields 4.478.472 0,18424.218 Impala Platinum 11.503.603 0,46575.433 Imperial 10.291.436 0,411.140.784 MTN 24.107.685 0,96501.672 Murray & Roberts Holdings 2.200.572 0,09226.062 Naspers 12.699.536 0,51444.356 Raubex 1.070.138 0,04326.080 Sasol 17.105.986 0,68499.438 Shoprite 7.444.065 0,30Le note da pagina 17 a pagina 62 costituiscono parte integrante del presente bilancio.
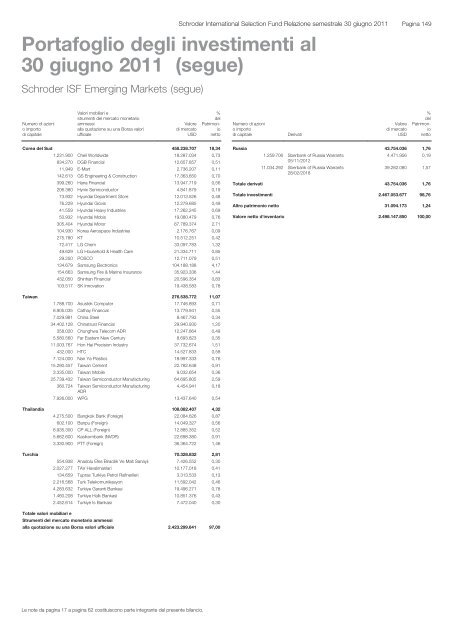
Schroder International Selection Fund <strong>Relazione</strong> <strong>semestrale</strong> 30 giugno 2011Portafoglio degli investimenti al30 giugno 2011 (segue)Pagina 149Schroder ISF Emerging Markets (segue)Schroder ISF Emerging Markets (segue)Numero di azionio importodi capitaleValori mobiliari estrumenti del mercato monetarioammessialla quotazione su una Borsa valoriufficialeValoredi mercatoUSD%delPatrimonionettoNumero di azionio importodi capitaleDerivatiValoredi mercatoUSD%delPatrimonionettoCorea del Sud 458.238.707 18,341.231.900 Cheil Worldwide 18.287.034 0,73834.270 DGB Financial 12.657.857 0,5111.949 E-Mart 2.736.207 0,11142.613 GS Engineering & Construction 17.363.650 0,70399.260 Hana Financial 13.947.719 0,56206.380 Hynix Semiconductor 4.841.879 0,1973.932 Hyundai Department Store 12.013.526 0,4876.229 Hyundai Glovis 12.279.685 0,4941.559 Hyundai Heavy Industries 17.262.245 0,6950.932 Hyundai Mobis 19.080.479 0,76305.404 Hyundai Motor 67.789.374 2,71104.930 Korea Aerospace Industries 2.176.767 0,09275.780 KT 10.512.251 0,4272.417 LG Chem 33.097.783 1,3249.629 LG Household & Health Care 21.334.711 0,8529.250 POSCO 12.711.079 0,51134.679 Samsung Electronics 104.188.188 4,17154.663 Samsung Fire & Marine Insurance 35.923.336 1,44432.050 Shinhan Financial 20.596.354 0,83103.517 SK Innovation 19.438.583 0,78Russia 43.754.036 1,761.259.706 Sberbank of Russia Warrants4.471.956 0,1905/11/201211.034.292 Sberbank of Russia Warrants28/02/201839.282.080 1,57Totale derivati 43.754.036 1,76Totale investimenti 2.467.053.677 98,76Altro patrimonio netto 31.094.173 1,24Valore netto d'inventario 2.498.147.850 100,00Taiwan 276.538.772 11,071.788.700 Asustek Computer 17.746.893 0,718.905.035 Cathay Financial 13.779.941 0,557.029.981 China Steel 8.467.793 0,3434.402.128 Chinatrust Financial 29.940.930 1,20358.020 Chunghwa Telecom ADR 12.247.864 0,495.580.560 Far Eastern New Century 8.693.823 0,3511.003.767 Hon Hai Precision Industry 37.732.674 1,51432.000 HTC 14.527.833 0,587.124.000 Nan Ya Plastics 18.997.333 0,7615.290.457 Taiwan Cement 22.782.648 0,913.335.000 Taiwan Mobile 9.032.654 0,3625.739.432 Taiwan Semiconductor Manufacturing 64.695.805 2,59360.724 Taiwan Semiconductor Manufacturing4.454.941 0,18ADR7.926.000 WPG 13.437.640 0,54Thailandia 108.082.407 4,324.275.500 Bangkok Bank (Foreign) 22.084.626 0,87602.100 Banpu (Foreign) 14.049.327 0,568.935.300 CP ALL (Foreign) 12.885.352 0,525.662.600 Kasikornbank (NVDR) 22.698.380 0,913.330.900 PTT (Foreign) 36.364.722 1,46Turchia 70.328.832 2,81554.938 Anadolu Efes Biracilik Ve Malt Sanayii 7.426.552 0,302.027.277 TAV Havalimanlari 10.177.018 0,41134.659 Tupras Turkiye Petrol Rafinerileri 3.313.533 0,132.216.568 Turk Telekomunikasyon 11.592.042 0,464.283.632 Turkiye Garanti Bankasi 19.496.271 0,781.460.208 Turkiye Halk Bankasi 10.851.376 0,432.452.614 Turkiye Is Bankasi 7.472.040 0,30Totale valori mobiliari eStrumenti del mercato monetario ammessialla quotazione su una Borsa valori ufficiale 2.423.299.641 97,00Le note da pagina 17 a pagina 62 costituiscono parte integrante del presente bilancio.