Relazione semestrale
Relazione semestrale
Relazione semestrale
- No tags were found...

Create successful ePaper yourself
Turn your PDF publications into a flip-book with our unique Google optimized e-Paper software.
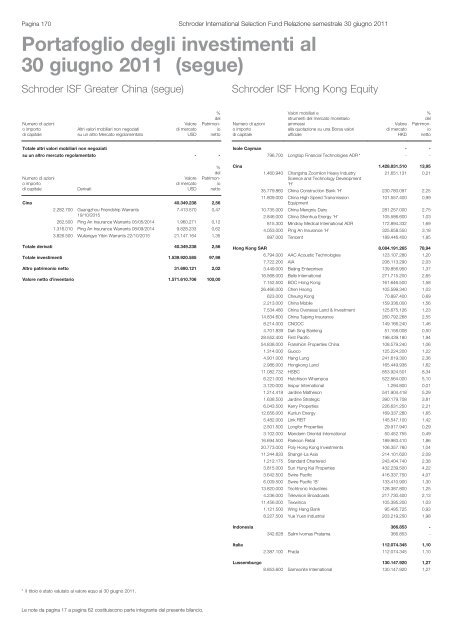
Pagina 170 Schroder International Selection Fund <strong>Relazione</strong> <strong>semestrale</strong> 30 giugno 2011Portafoglio degli investimenti al30 giugno 2011 (segue)Schroder ISF Greater China (segue)Schroder ISF Hong Kong EquityNumero di azionio importodi capitaleAltri valori mobiliari non negoziatisu un altro Mercato regolamentatoValoredi mercatoUSD%delPatrimonionettoNumero di azionio importodi capitaleValori mobiliari estrumenti del mercato monetarioammessialla quotazione su una Borsa valoriufficialeValoredi mercatoHKD%delPatrimonionettoTotale altri valori mobiliari non negoziatisu un altro mercato regolamentato - -Numero di azionio importodi capitaleDerivatiValoredi mercatoUSD%delPatrimonionettoCina 40.349.238 2,562.282.700 Guangzhou Friendship Warrants7.413.570 0,4719/10/2015262.500 Ping An Insurance Warrants 05/05/2014 1.960.271 0,121.316.010 Ping An Insurance Warrants 08/09/2014 9.828.233 0,623.826.500 Wuliangye Yibin Warrants 22/10/2015 21.147.164 1,35Totale derivati 40.349.238 2,56Totale investimenti 1.539.920.585 97,98Altro patrimonio netto 31.690.121 2,02Valore netto d'inventario 1.571.610.706 100,00Isole Cayman - -796.700 Longtop Financial Technologies ADR * - -Cina 1.428.831.510 13,951.460.940 Changsha Zoomlion Heavy IndustryScience and Technology Development'H'21.651.131 0,2135.779.860 China Construction Bank 'H' 230.780.097 2,2511.809.000 China High Speed Transmission101.557.400 0,99Equipment10.735.000 China Mengniu Dairy 281.257.000 2,752.846.000 China Shenhua Energy ‘H’ 105.586.600 1,03815.300 Mindray Medical International ADR 172.894.332 1,694.053.000 Ping An Insurance ‘H’ 325.658.550 3,18897.000 Tencent 189.446.400 1,85Hong Kong SAR 8.084.191.265 78,946.794.000 AAC Acoustic Technologies 123.107.280 1,207.722.200 AIA 208.113.290 2,033.449.000 Beijing Enterprises 139.856.950 1,3716.568.000 Belle International 271.715.200 2,657.152.500 BOC Hong Kong 161.646.500 1,5826.466.000 Chen Hsong 105.599.340 1,03623.000 Cheung Kong 70.897.400 0,692.213.000 China Mobile 159.336.000 1,567.534.480 China Overseas Land & Investment 125.675.126 1,2314.834.600 China Taiping Insurance 260.792.268 2,558.214.000 CNOOC 149.166.240 1,464.701.839 Dah Sing Banking 51.156.008 0,5028.552.400 First Pacific 198.439.180 1,9454.838.000 Franshion Properties China 108.579.240 1,061.314.000 Guoco 125.224.200 1,224.901.000 Hang Lung 241.619.300 2,362.986.000 Hongkong Land 165.449.936 1,6211.082.732 HSBC 853.924.501 8,346.221.000 Hutchison Whampoa 522.564.000 5,103.120.000 Inspur International 1.294.800 0,011.214.418 Jardine Matheson 541.904.418 5,291.638.500 Jardine Strategic 390.179.708 3,816.043.500 Kerry Properties 226.631.250 2,2112.656.000 Kunlun Energy 169.337.280 1,655.482.000 Link REIT 145.547.100 1,422.501.500 Longfor Properties 29.917.940 0,293.102.000 Mandarin Oriental International 50.452.755 0,4916.694.500 Parkson Retail 189.983.410 1,8620.773.000 Poly Hong Kong Investments 106.357.760 1,0411.244.833 Shangri-La Asia 214.101.620 2,091.212.175 Standard Chartered 243.404.740 2,383.815.000 Sun Hung Kai Properties 432.239.500 4,223.642.500 Swire Pacific 416.337.750 4,076.009.500 Swire Pacific 'B' 133.410.900 1,3013.820.000 Techtronic Industries 128.387.800 1,254.236.000 Television Broadcasts 217.730.400 2,1311.456.000 Texwinca 105.395.200 1,031.121.500 Wing Hang Bank 95.495.725 0,938.227.500 Yue Yuen Industrial 203.219.250 1,98Indonesia 366.853 -342.628 Salim Ivomas Pratama 366.853 -Italia 112.074.345 1,102.387.100 Prada 112.074.345 1,10Lussemburgo 130.147.920 1,278.853.600 Samsonite International 130.147.920 1,27* Il titolo è stato valutato al valore equo al 30 giugno 2011.Le note da pagina 17 a pagina 62 costituiscono parte integrante del presente bilancio.