Climate Change and the European Water Dimension - Agri ...
Climate Change and the European Water Dimension - Agri ...
Climate Change and the European Water Dimension - Agri ...

Create successful ePaper yourself
Turn your PDF publications into a flip-book with our unique Google optimized e-Paper software.
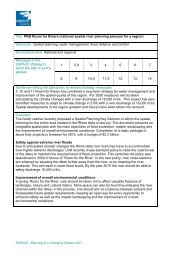
South Eastern regions (see Table V.D.1). At <strong>the</strong> same time, <strong>the</strong> Mediterranean <strong>and</strong><br />
South Eastern regions represent <strong>the</strong> areas with <strong>the</strong> highest proportion of irrigated<br />
agriculture as well as with <strong>the</strong> largest rural population shares. Table V.D.1 gives an<br />
overview on l<strong>and</strong> use <strong>and</strong> population statistics for <strong>the</strong> different regions distinguished<br />
above.<br />
Table V.D.1: L<strong>and</strong> Use <strong>and</strong> population in different regions of Europe based on FAO<br />
statistics from 1998 (l<strong>and</strong> use) <strong>and</strong> 1995 (population).<br />
Region <strong>Agri</strong>cultural Area Population<br />
Mill. ha % of<br />
L<strong>and</strong><br />
%<br />
Irrigated<br />
146<br />
Total<br />
(Mill.)<br />
Rural<br />
(%)<br />
Rural<br />
(Mill.)<br />
1. Nordic 6.6 6 5 19 25 4.8<br />
2. British Isles 21.9 70 0 62 13 8.1<br />
3. Western 53.4 52 7 171 17 29.1<br />
4. Mediterranean 58.1 56 14 118 33 38.9<br />
5. Alpine 5.0 40 1 15 37 5.6<br />
6. North Eastern 22.7 57 1 49 36 17.6<br />
7. South Eastern 44.0 57 10 72 42 30.2<br />
8. Eastern 286.9 16 3 173 27 46.7<br />
Source: adapted from Olesen <strong>and</strong> Bindi 2002<br />
V.D.3. <strong>European</strong> <strong>Agri</strong>culture <strong>and</strong> <strong>Water</strong> Use<br />
In Europe, large amounts of water are abstracted from both surface <strong>and</strong> groundwater<br />
stocks for households, industry <strong>and</strong> agriculture every year. For Europe as a whole<br />
(including New Member States <strong>and</strong> Accession Countries) some 38% of <strong>the</strong><br />
abstracted water is used for agricultural purposes, while domestic uses, industry <strong>and</strong><br />
energy production account for 18%, 11%, <strong>and</strong> 33%, respectively (EEA WQ2,<br />
numbers based on New Cronos Eurostat-OECD JQ2002) 4 .<br />
However, large differences exist across <strong>the</strong> continent. In Malta, Cyprus <strong>and</strong> Turkey,<br />
for example, almost 80% of <strong>the</strong> abstracted water is used for agriculture, <strong>and</strong> in <strong>the</strong><br />
southwestern countries (Portugal, Spain, France, Italy, Greece) still about 46% of <strong>the</strong><br />
abstracted water is used for this purpose. In <strong>the</strong> central <strong>and</strong> nor<strong>the</strong>rn countries<br />
(Austria, Belgium, Denmark, Germany, Irel<strong>and</strong>, Luxembourg, Ne<strong>the</strong>rl<strong>and</strong>s, UK, <strong>and</strong><br />
Sc<strong>and</strong>inavia), to <strong>the</strong> contrary, agricultural use of <strong>the</strong> abstracted water is limited to<br />
less than 5%, while more than 50% of <strong>the</strong> abstracted water goes into energy<br />
production (a non-consumptive use).<br />
By far <strong>the</strong> largest part of <strong>the</strong> water used in agriculture is used for irrigation. This<br />
percentage approaches 100% in <strong>the</strong> sou<strong>the</strong>rn <strong>European</strong> countries, which at <strong>the</strong><br />
same time have <strong>the</strong> largest share of irrigated l<strong>and</strong> in Europe (74% of <strong>the</strong> total<br />
irrigated area). During <strong>the</strong> 1990s a slight decrease in water used for irrigation has<br />
1 All numbers in this chapter are to be viewed as approximate. Figures change slightly from<br />
publication to publication due to varying regional references <strong>and</strong> data sources. While <strong>the</strong>y give a good<br />
indication of <strong>the</strong> order of magnitude, absolute values may change depending on <strong>the</strong> regional grouping<br />
of countries <strong>and</strong> <strong>the</strong> statistical sources.