Climate Change and the European Water Dimension - Agri ...
Climate Change and the European Water Dimension - Agri ...
Climate Change and the European Water Dimension - Agri ...
You also want an ePaper? Increase the reach of your titles
YUMPU automatically turns print PDFs into web optimized ePapers that Google loves.
Mean depth, m<br />
Phytoplankton biomass, mgWW m -3<br />
<strong>Water</strong> column irradiance, %<br />
TN, mg l -1<br />
3.6<br />
3.4<br />
3.2<br />
3.0<br />
2.8<br />
2.6<br />
2.4<br />
2.2<br />
80<br />
70<br />
60<br />
50<br />
40<br />
30<br />
20<br />
10<br />
30<br />
26<br />
22<br />
18<br />
14<br />
10<br />
6<br />
4.5<br />
4.0<br />
3.5<br />
3.0<br />
2.5<br />
2.0<br />
1.5<br />
1.0<br />
0.5<br />
0.0<br />
Depth year<br />
Depth spring<br />
2.0<br />
1.8<br />
1.6<br />
Depth year: r = 0.3194, p = 0.0041<br />
Depth spring: r = 0.3893, p = 0.0004<br />
-3 -2 -1 0 1 2 3 4<br />
Year<br />
Spring<br />
Summer<br />
Autumn<br />
NAOw<br />
Year: r = -0.59, p = 0.00009<br />
Spring: r = -0.08, p = 0.6<br />
Summer: r = -0.59, p = 0.00009<br />
Autumn: r = -0.49, p = 0.0026<br />
0<br />
1.6 1.8 2.0 2.2 2.4 2.6 2.8 3.0 3.2<br />
Yearly average lake depth, m<br />
< 2 2 - 3 > 3<br />
Average lake depth, m<br />
< 2 2 - 3 > 3<br />
Average lake depth, m<br />
164<br />
TP, mg m -3<br />
TN/TP, mg mg -1<br />
80 Year: r = -0.02, p = 0.9<br />
Spring: r = 0.48, p = 0.004<br />
70 Summer: r = -0.1, p = 0.5<br />
Autumn: r = -0.08, p = 0.6<br />
60<br />
0<br />
-3 -2 -1 0 1<br />
NAOw<br />
2 3 4<br />
220<br />
180<br />
140<br />
100<br />
60<br />
20<br />
-20<br />
90<br />
70<br />
50<br />
30<br />
10<br />
-10<br />
< 2 2 - 3 > 3<br />
Average lake depth, m<br />
< 2 2 - 3 > 3<br />
Average lake depth, m<br />
Figure VI.A.12. Relationship between <strong>the</strong> mean depth <strong>and</strong> concentration of total nitrogen<br />
(TN), total phosphorus (TP), TN/TP mass ratio <strong>and</strong> average irradiance of <strong>the</strong> water column in<br />
L. Võrtsjärv (Nõges et al. 2003).<br />
Several winter fish-kills have been documented in Lake Võrtsjärv during <strong>the</strong> last<br />
century (in 1939, 1948, 1967, 1969, 1978, 1987, 1996). One reason for <strong>the</strong>se fishkills<br />
is <strong>the</strong> depletion of oxygen in low-water years during late winter when <strong>the</strong> underice<br />
oxygen concentration dropped faster due to smaller amount dissolved in <strong>the</strong><br />
Phytoplankton biomass, mgWW m -3<br />
50<br />
40<br />
30<br />
20<br />
10<br />
Year<br />
Spring<br />
Summer<br />
Autumn<br />
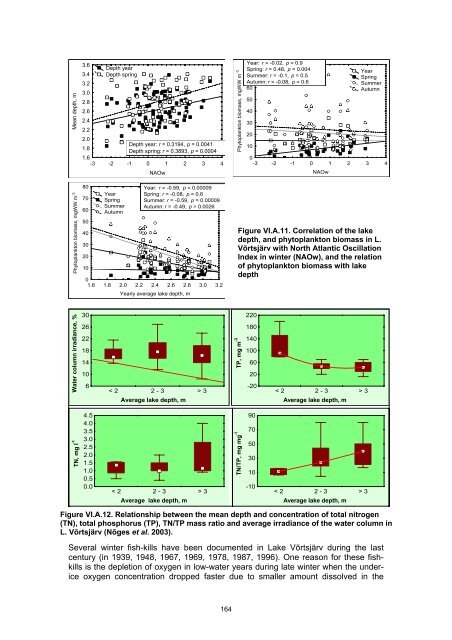
Figure VI.A.11. Correlation of <strong>the</strong> lake<br />
depth, <strong>and</strong> phytoplankton biomass in L.<br />
Võrtsjärv with North Atlantic Oscillation<br />
Index in winter (NAOw), <strong>and</strong> <strong>the</strong> relation<br />
of phytoplankton biomass with lake<br />
depth


