Climate Change and the European Water Dimension - Agri ...
Climate Change and the European Water Dimension - Agri ...
Climate Change and the European Water Dimension - Agri ...

You also want an ePaper? Increase the reach of your titles
YUMPU automatically turns print PDFs into web optimized ePapers that Google loves.
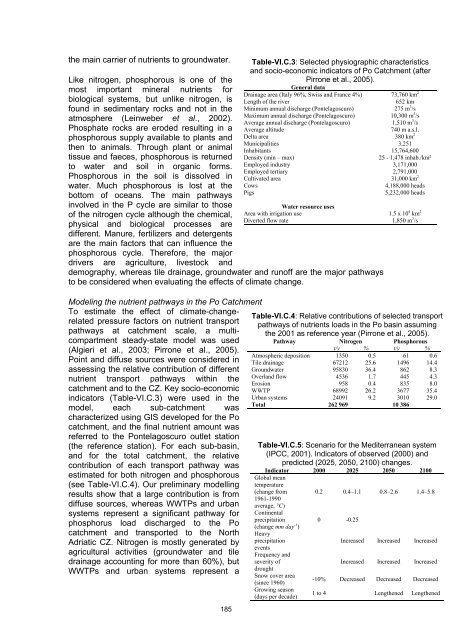
<strong>the</strong> main carrier of nutrients to groundwater.<br />
Like nitrogen, phosphorous is one of <strong>the</strong><br />
most important mineral nutrients for<br />
biological systems, but unlike nitrogen, is<br />
found in sedimentary rocks <strong>and</strong> not in <strong>the</strong><br />
atmosphere (Leinweber et al., 2002).<br />
Phosphate rocks are eroded resulting in a<br />
phosphorous supply available to plants <strong>and</strong><br />
<strong>the</strong>n to animals. Through plant or animal<br />
tissue <strong>and</strong> faeces, phosphorous is returned<br />
to water <strong>and</strong> soil in organic forms.<br />
Phosphorous in <strong>the</strong> soil is dissolved in<br />
water. Much phosphorous is lost at <strong>the</strong><br />
bottom of oceans. The main pathways<br />
involved in <strong>the</strong> P cycle are similar to those<br />
of <strong>the</strong> nitrogen cycle although <strong>the</strong> chemical,<br />
physical <strong>and</strong> biological processes are<br />
different. Manure, fertilizers <strong>and</strong> detergents<br />
are <strong>the</strong> main factors that can influence <strong>the</strong><br />
phosphorous cycle. Therefore, <strong>the</strong> major<br />
drivers are agriculture, livestock <strong>and</strong><br />
demography, whereas tile drainage, groundwater <strong>and</strong> runoff are <strong>the</strong> major pathways<br />
to be considered when evaluating <strong>the</strong> effects of climate change.<br />
Modeling <strong>the</strong> nutrient pathways in <strong>the</strong> Po Catchment<br />
To estimate <strong>the</strong> effect of climate-changerelated<br />
pressure factors on nutrient transport<br />
pathways at catchment scale, a multicompartment<br />
steady-state model was used<br />
(Algieri et al., 2003; Pirrone et al., 2005).<br />
Point <strong>and</strong> diffuse sources were considered in<br />
assessing <strong>the</strong> relative contribution of different<br />
nutrient transport pathways within <strong>the</strong><br />
catchment <strong>and</strong> to <strong>the</strong> CZ. Key socio-economic<br />
indicators (Table-VI.C.3) were used in <strong>the</strong><br />
model, each sub-catchment was<br />
characterized using GIS developed for <strong>the</strong> Po<br />
catchment, <strong>and</strong> <strong>the</strong> final nutrient amount was<br />
referred to <strong>the</strong> Pontelagoscuro outlet station<br />
(<strong>the</strong> reference station). For each sub-basin,<br />
<strong>and</strong> for <strong>the</strong> total catchment, <strong>the</strong> relative<br />
contribution of each transport pathway was<br />
estimated for both nitrogen <strong>and</strong> phosphorous<br />
(see Table-VI.C.4). Our preliminary modelling<br />
results show that a large contribution is from<br />
diffuse sources, whereas WWTPs <strong>and</strong> urban<br />
systems represent a significant pathway for<br />
phosphorus load discharged to <strong>the</strong> Po<br />
catchment <strong>and</strong> transported to <strong>the</strong> North<br />
Adriatic CZ. Nitrogen is mostly generated by<br />
agricultural activities (groundwater <strong>and</strong> tile<br />
drainage accounting for more than 60%), but<br />
WWTPs <strong>and</strong> urban systems represent a<br />
185<br />
Table-VI.C.3: Selected physiographic characteristics<br />
<strong>and</strong> socio-economic indicators of Po Catchment (after<br />
Pirrone et al., 2005).<br />
General data<br />
Drainage area (Italy 96%, Swiss <strong>and</strong> France 4%) 73,760 km 2<br />
Length of <strong>the</strong> river 652 km<br />
Minimum annual discharge (Pontelagoscuro) 275 m 3 /s<br />
Maximum annual discharge (Pontelagoscuro) 10,300 m 3 /s<br />
Average annual discharge (Pontelagoscuro) 1,510 m 3 /s<br />
Average altitude 740 m a.s.l.<br />
Delta area 380 km 2<br />
Municipalities 3,251<br />
Inhabitants 15,764,600<br />
Density (min – max) 25 - 1,478 inhab./km²<br />
Employed industry 3,171,000<br />
Employed tertiary 2,791,000<br />
Cultivated area 31,000 km 2<br />
Cows 4,188,000 heads<br />
Pigs 5,232,000 heads<br />
<strong>Water</strong> resource uses<br />
Area with irrigation use 1.5 x 10 4 km 2<br />
Diverted flow rate 1,850 m 3 /s<br />
Table-VI.C.4: Relative contributions of selected transport<br />
pathways of nutrients loads in <strong>the</strong> Po basin assuming<br />
<strong>the</strong> 2001 as reference year (Pirrone et al., 2005).<br />
Pathway Nitrogen Phosphorous<br />
t/y % t/y %<br />
Atmospheric deposition 1350 0.5 61 0.6<br />
Tile drainage 67212 25.6 1496 14.4<br />
Groundwater 95830 36.4 862 8.3<br />
Overl<strong>and</strong> flow 4536 1.7 445 4.3<br />
Erosion 958 0.4 835 8.0<br />
WWTP 68992 26.2 3677 35.4<br />
Urban systems 24091 9.2 3010 29.0<br />
Total 262 969 10 386<br />
Table-VI.C.5: Scenario for <strong>the</strong> Mediterranean system<br />
(IPCC, 2001). Indicators of observed (2000) <strong>and</strong><br />
predicted (2025, 2050, 2100) changes.<br />
Indicator 2000 2025 2050 2100<br />
Global mean<br />
temperature<br />
(change from<br />
1961-1990<br />
average, °C)<br />
Continental<br />
precipitation<br />
(change mm day -1 )<br />
Heavy<br />
precipitation<br />
events<br />
Frequency <strong>and</strong><br />
severity of<br />
drought<br />
Snow cover area<br />
(since 1960)<br />
Growing season<br />
(days per decade)<br />
0.2 0.4–1.1 0.8–2.6 1.4–5.8<br />
0 -0.25<br />
Increased Increased Increased<br />
Increased Increased Increased<br />
-10% Decreased Decreased Decreased<br />
1 to 4 Leng<strong>the</strong>ned Leng<strong>the</strong>ned