Climate Change and the European Water Dimension - Agri ...
Climate Change and the European Water Dimension - Agri ...
Climate Change and the European Water Dimension - Agri ...

Create successful ePaper yourself
Turn your PDF publications into a flip-book with our unique Google optimized e-Paper software.
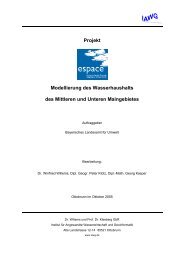
Mean Air<br />
Temperature<br />
(Dec.-March) [°C]<br />
3<br />
2<br />
1<br />
0<br />
-1<br />
r = 0.62,<br />
p < 0.01<br />
-2<br />
-4 -2 0 2 4 6<br />
NAO-Index<br />
4<br />
log 10( Daphnia<br />
biomass in May)<br />
[mg C/sqm]<br />
3<br />
2<br />
1<br />
NAO<br />
Local Meteorology<br />
r = 0.73,<br />
p < 0.005<br />
7 8 9 10 11 12<br />
<strong>Water</strong>Temperature in<br />
May [°C]<br />
180<br />
CWT<br />
[julian day]<br />
170<br />
160<br />
150<br />
140<br />
130<br />
<strong>Water</strong> Temperature<br />
Daphnia<br />
growth <strong>and</strong> biomass<br />
The ENSO is <strong>the</strong> most important global circulation pattern with serious influences in<br />
<strong>the</strong> Sou<strong>the</strong>rn hemisphere, but also in Nor<strong>the</strong>rn America. ENSO results from a cyclic<br />
warming <strong>and</strong> cooling of <strong>the</strong> surface ocean of <strong>the</strong> central <strong>and</strong> eastern Pacific.<br />
Warming anomalies (El Nino events) <strong>and</strong> cooling anomalies (La Nina events) have<br />
severe consequences for world climate. Indices describing ENSO variability are<br />
based on pressure differences (e.g. <strong>the</strong> Sou<strong>the</strong>rn Oscillation index is based on<br />
pressure differences between Tahiti <strong>and</strong> Darwin) or anomalies in sea surface<br />
temperatures (e.g., NINO3, NINO4, Nino3.4). Positive SOI values indicate La Nina<br />
events, <strong>and</strong> negative values reflect El Nino events. While <strong>the</strong> teleconnection patterns<br />
of ENSO to <strong>the</strong> tropics <strong>and</strong> to some extra-tropical areas around <strong>the</strong> Pacific are well<br />
documented <strong>and</strong> shown to be strong, <strong>the</strong> influence of ENSO on <strong>European</strong> climate<br />
appears to be weaker <strong>and</strong> was, until recently, less studied (Moron <strong>and</strong> Ward 1998).<br />
Van Loon <strong>and</strong> Madden (1981) have noted a decrease in temperature <strong>and</strong><br />
precipitation in Sc<strong>and</strong>inavia during winters of El Nino conditions. Also, El Nino years<br />
are related to an increase of days with cyclonic circulation types (Großwetterlagen) in<br />
Engl<strong>and</strong> (Wilby 1993) <strong>and</strong> Germany (Fraedrich 1994). During recent years <strong>the</strong> ENSO<br />
teleconnection patterns to Europe have received more attention <strong>and</strong> several studies<br />
recognize a distinct ENSO influence on <strong>European</strong> climate (Rodó et al. 1997; Van<br />
Oldenborgh et al. 2000; Mariotti et al. 2002; Merkel <strong>and</strong> Latif 2002; Lloyd-Hughes<br />
<strong>and</strong> Saunders 2002; Knippertz et al. 2003; Moron <strong>and</strong> Plaut 2003; Matyasovszky<br />
2003; Greatbatch et al. 2004).<br />
Spring (MAM) precipitation in distinct <strong>European</strong> regions is significantly related to <strong>the</strong><br />
NINO3 Index with a lag of three months. Strongest positive correlations occur over<br />
Sou<strong>the</strong>rn Engl<strong>and</strong>, nor<strong>the</strong>rn France, <strong>the</strong> Low Countries <strong>and</strong> Germany, whereas in<br />
Eastern Spain negative correlations occur during spring (Van Oldenborgh et al.<br />
2000). In addition, western Mediterranean rainfall in autumn is shown to be<br />
49<br />
r = -0.84<br />
p < 0.0001<br />
1 2 3 4<br />
log 10( Daphnia biomass<br />
in May) [mg C/sqm]<br />
CWT<br />
[julian day]<br />
180<br />
170<br />
160<br />
150<br />
140<br />
130<br />
Daphnia grazing<br />
-3 -1 1 3 5<br />
NAO-Index<br />
CWT<br />
r = -0.55<br />
p < 0.05<br />
Figure IV.A.3. Cascading influence of <strong>the</strong> NAO from local meteorology<br />
towards food-web interactions in Lake Constance (from Straile et al 2003)