- Page 1 and 2:
DIFFERING RESPONSES TO AN INDUSTRIA
- Page 3 and 4:
This is a study of male occupationa
- Page 5 and 6:
Acknowledgements I would like to ac
- Page 7 and 8:
Appendix 11 Comparison of adult mal
- Page 9 and 10:
CHAPTER ONE INTRODUCTION: THE AIMS,
- Page 11 and 12:
area to complement that found by th
- Page 13 and 14:
Although the precise meaning behind
- Page 15 and 16:
also describes the sources and meth
- Page 17 and 18:
of the poor and lists of parish app
- Page 19 and 20:
Probate records Although probate re
- Page 21 and 22:
and harvested by cutting, whereas f
- Page 23 and 24:
about the family and businesses of
- Page 25 and 26:
allowing comparison between the dif
- Page 27 and 28:
the ratio of agricultural to non-ag
- Page 29 and 30:
multiple occupations is also incons
- Page 31 and 32:
Appendix 23. 52 These documents rec
- Page 33 and 34:
surveying occupations in the Needle
- Page 35 and 36:
and periods therefore have to be tr
- Page 37 and 38:
enjoying its status as a market tow
- Page 39 and 40:
was of course very similar to that
- Page 41 and 42:
Buchanan has shown that to a large
- Page 43 and 44:
industry. 80 Some of these factors
- Page 45 and 46:
Yelling has shown that in both the
- Page 47 and 48:
osy picture than Rowlands of the me
- Page 49 and 50:
other regions, for instance Manches
- Page 51 and 52:
marriage and larger families, but p
- Page 53 and 54:
of women and children in the econom
- Page 55 and 56:
sources often favoured by the wealt
- Page 57 and 58:
Table 3.1 Population of Whole Study
- Page 59 and 60:
Between 1751 and 1801 the populatio
- Page 61 and 62:
Alcester fared particularly badly i
- Page 63 and 64:
Taking a mean average figure of app
- Page 65 and 66:
sound. 34 The figures circa 1780 fo
- Page 67 and 68:
person to every acre and by 1841 0.
- Page 69 and 70:
The baptism numbers in Table 3.9 co
- Page 71 and 72:
shown in Table 3.11. 47 The apparen
- Page 73 and 74:
y a further 136.7% to 1841. 52 Othe
- Page 75 and 76:
Table 3.15 Population densities 167
- Page 77 and 78:
seventeenth to the nineteenth centu
- Page 79 and 80:
sources such as smaller population
- Page 81 and 82:
Table 4.2 Males in probate in speci
- Page 83 and 84:
the mid-eighteenth century, and mos
- Page 85 and 86:
Table 4.7 Occupational structure in
- Page 87 and 88:
For comparative purposes data from
- Page 89 and 90:
In comparison with probate data the
- Page 91 and 92:
ways by different townsfolk: to gra
- Page 93 and 94:
gained currency in non-legal parlan
- Page 95 and 96:
In Period A glaziers benefited from
- Page 97 and 98:
the knitters, other occupations in
- Page 99 and 100:
dyers. 83 Some Alcester weavers may
- Page 101 and 102:
‘to learn the art and mystery of
- Page 103 and 104:
thereof must have gone out of fashi
- Page 105 and 106:
apparent. 119 If they were added to
- Page 107 and 108:
town. 130 Although in Period C the
- Page 109 and 110:
UBD contains no glovers, but one fe
- Page 111 and 112:
making malt, while the Harris famil
- Page 113 and 114:
served as a juror and occupied his
- Page 115 and 116:
Throughout the study period Alceste
- Page 117 and 118:
their shop near Alcester church. No
- Page 119 and 120:
apprenticeship in Alcester’s gunm
- Page 121 and 122:
spreading fast, profitability was n
- Page 123 and 124:
ironmongers in 1835 was female. 216
- Page 125 and 126:
earlier times, by the 1790s coaches
- Page 127 and 128:
source of income for the court leet
- Page 129 and 130:
apparently increased through the st
- Page 131 and 132:
The only brewer described as such i
- Page 133 and 134:
was also a haberdasher, his mother
- Page 135 and 136:
in the first half of the nineteenth
- Page 137 and 138:
grammar school, directories now lis
- Page 139 and 140:
Lord Brooke of Warwick’s parliame
- Page 141 and 142:
credit furnished by gentlemen and g
- Page 143 and 144:
for actors), baptised children in A
- Page 145 and 146:
More hidden was the part played by
- Page 147 and 148:
CHAPTER FIVE ZONE B: THE SOUTHERN (
- Page 149 and 150:
Table 5.1 Male occupational structu
- Page 151 and 152:
In Table 5.3 marriage licence data
- Page 153 and 154:
Table 5.6 Male occupational structu
- Page 155 and 156:
Table 5.8 Occupational structure in
- Page 157 and 158:
Gloucestershire ‘Men and Armour
- Page 159 and 160:
air wholesome and healthful. The so
- Page 161 and 162:
less flexibility for labourers, so
- Page 163 and 164:
labour and access to commons to eke
- Page 165 and 166:
Extractive industries and building
- Page 167 and 168:
together the 1841 census has a figu
- Page 169 and 170:
Textiles, clothing and paper Ramsay
- Page 171 and 172:
vulnerable to slumps in the market.
- Page 173 and 174:
wool-carder and wool-spinner. In th
- Page 175 and 176:
manufacture include mantua-makers,
- Page 177 and 178:
often well-connected compared to ot
- Page 179 and 180:
Over the two centuries a couple of
- Page 181 and 182:
formed part of an increasing consum
- Page 183 and 184:
Although the numbers involved in tr
- Page 185 and 186:
Some of Bidford’s inns had wharve
- Page 187 and 188:
category we find Richard Rawlins, m
- Page 189 and 190:
In Victorian times perukemakers and
- Page 191 and 192:
struggled as a market centre, Bidfo
- Page 193 and 194:
Before the censuses the many domest
- Page 195 and 196:
The Avon was always important for t
- Page 197 and 198:
the mid-nineteenth century. 6 Possi
- Page 199 and 200:
could have been ripe for industrial
- Page 201 and 202:
comparative revival in Period D. Th
- Page 203 and 204:
Table 6.5 Male occupational structu
- Page 205 and 206:
The 1841 census has lower figures f
- Page 207 and 208:
Table 6.9b Occupational structure i
- Page 209 and 210:
Agriculture The soil in the west of
- Page 211 and 212:
opportunities for casual work in th
- Page 213 and 214:
In Period D other occupations assoc
- Page 215 and 216:
ooms and a buttery and cheese-chamb
- Page 217 and 218:
etween quarrying and non-quarrying
- Page 219 and 220:
involved in textile or paper sector
- Page 221 and 222:
are low. As well as farming, weaver
- Page 223 and 224:
The flax-dresser on the Ridgeway at
- Page 225 and 226:
fathers in Period D. The 1841 censu
- Page 227 and 228:
Chandlers were never abundant in th
- Page 229 and 230:
underwoods on their property, proba
- Page 231 and 232:
Among the wealthier blacksmiths was
- Page 233 and 234:
local market was sufficient to make
- Page 235 and 236:
with other occupations. 166 Thomas
- Page 237 and 238:
something of a novelty in these par
- Page 239 and 240:
Larger villages served as entrepots
- Page 241 and 242:
apothecaries and midwives before 18
- Page 243 and 244:
Baptism registers (1813-1840) place
- Page 245 and 246:
In Period C although quarrying and
- Page 247 and 248:
CHAPTER SEVEN ZONE D: THE NORTHERN
- Page 249 and 250:
when there were 3314 inhabitants. A
- Page 251 and 252:
Table 7.1 Male occupational structu
- Page 253 and 254:
Table 7.4 Bridegrooms from marriage
- Page 255 and 256:
different nature of the two towns.
- Page 257 and 258:
Between 1680 and 1780 the parish re
- Page 259 and 260:
Table 7.11 Male occupational struct
- Page 261 and 262:
Table 7.13 Male occupational struct
- Page 263 and 264:
Table 7.16 Male occupational struct
- Page 265 and 266:
Information from Coughton burial re
- Page 267 and 268:
Table 7.22 Male occupational struct
- Page 269 and 270:
In investigating the bias between s
- Page 271 and 272:
mere two. The patterns shown in the
- Page 273 and 274:
pigs and considerable cheese produc
- Page 275 and 276:
Extractive and building industries
- Page 277 and 278:
glaziers working in churches and pu
- Page 279 and 280:
a poor journeyman tailor whose only
- Page 281 and 282:
Feckenham Forest. In turn they rece
- Page 283 and 284:
as well as his own. 119 In 1798 a b
- Page 285 and 286:
who continued to be a particularly
- Page 287 and 288:
tanners were amongst the most afflu
- Page 289 and 290:
gentleman, who served as high const
- Page 291 and 292:
seems to die out with them although
- Page 293 and 294:
wheelwrights also turned their hand
- Page 295 and 296:
Maybe labourers or woodmen undertoo
- Page 297 and 298:
Hemming family in Studley, which co
- Page 299 and 300:
in the Feckenham Forest. It was che
- Page 301 and 302:
distances to find employment. 220 T
- Page 303 and 304:
Stourbridge wire-drawers. 228 None
- Page 305 and 306:
Needlemakers. A dozen local needler
- Page 307 and 308:
eveal two other pin-makers in Tarde
- Page 309 and 310:
during this period, the largest gro
- Page 311 and 312:
Those attracted into the industry w
- Page 313 and 314:
operated in their cottages largely
- Page 315 and 316:
Fairfax, who was paid by Feckenham
- Page 317 and 318:
approval from the workers, who fear
- Page 319 and 320:
and Warwickshire carriers, includin
- Page 321 and 322:
A Studley man, the unfortunately na
- Page 323 and 324:
After the completion of The Worcest
- Page 325 and 326:
‘proprietor of the gasworks’. 3
- Page 327 and 328:
meetings and dinners. 342 Throughou
- Page 329 and 330:
Ipsley was described as an oat-mill
- Page 331 and 332:
smithy. 362 His mercery shop must h
- Page 333 and 334:
Among the clothing and cloth retail
- Page 335 and 336:
a handful of such men. 384 Probate
- Page 337 and 338:
Before 1800 local records contain f
- Page 339 and 340:
various denominations, book-keeper,
- Page 341 and 342:
domestic servants’ jobs are speci
- Page 343 and 344:
the local needle trade in the eight
- Page 345 and 346:
igger population, but at this stage
- Page 347 and 348:
significant presence of needlemaker
- Page 349 and 350:
Innkeepers, retailers, dealers and
- Page 351 and 352:
The source in Table 8.5 is more com
- Page 353 and 354: Table 8.8 shows that proportionally
- Page 355 and 356: Throughout the study period the und
- Page 357 and 358: inventories cease, it is more diffi
- Page 359 and 360: your new shoes from the village cor
- Page 361 and 362: Table 8.11 Number of different male
- Page 363 and 364: Table 8.13 Number of different male
- Page 365 and 366: (66) had more occupations than othe
- Page 367 and 368: Table 8.18 Comparison of three pari
- Page 369 and 370: Wealth, status and mobility The sco
- Page 371 and 372: This crude ranking approximates to
- Page 373 and 374: General conclusions In this chapter
- Page 375 and 376: the study area’s needle masters l
- Page 377 and 378: In looking at the wider picture we
- Page 379 and 380: Upton-upon-Severn 19 SW, Tewkesbury
- Page 381 and 382: and keuper marl. Enclosure award 17
- Page 383 and 384: ‘Rich soil abundantly fertile in
- Page 385 and 386: manor before 1743. Aston Cantlow ha
- Page 387 and 388: Worcester diocese; middle division
- Page 389 and 390: Throckmortons. Much depopulation be
- Page 391 and 392: Feckenham - a very large parish of
- Page 393: separate parish register from the l
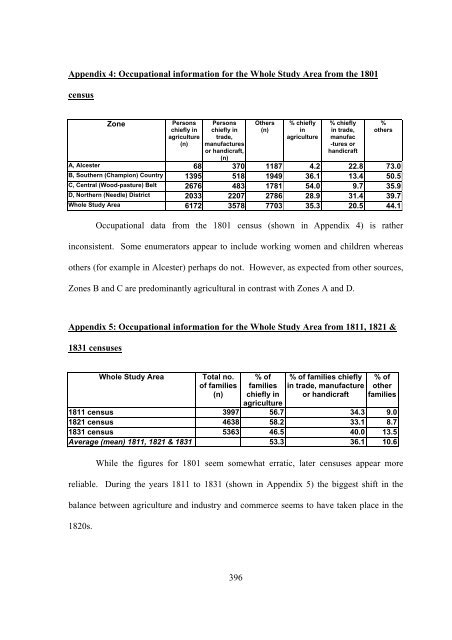
- Page 396 and 397: Appendix 2: Occupational descriptor
- Page 398 and 399: Textile, clothing and paper: Male:
- Page 400 and 401: Transport: Male: railway worker, to
- Page 402 and 403: Agriculture without labourers Labou
- Page 406 and 407: Appendix 7 continued: 1831 census:
- Page 408 and 409: Appendix 8: Harvington Collection u
- Page 410 and 411: Appendix 10: Bidford: Male occupati
- Page 412 and 413: sectors which increased their share
- Page 414: Markets surrounding the study area
- Page 417 and 418: Beoley Wake: Sunday following Old S
- Page 419 and 420: Appendix 14: Carrying network Below
- Page 421 and 422: Appendix 15:Turnpike Roads and Coac
- Page 423 and 424: 1830 Pigot’s Birmingham and Worce
- Page 427 and 428: Appendix 17: Water-mills and Windmi
- Page 429 and 430: Appendix 19: Parishes with schools
- Page 431 and 432: Needlemakers and associated trades
- Page 433 and 434: Appendix 22: Multiple occupations T
- Page 435 and 436: Metal Blacksmith - whitesmith, PO,
- Page 437 and 438: stand out as particularly numerous.
- Page 439 and 440: Appendix 23b Occupational structure
- Page 441 and 442: Appendix 24 : Land tax returns 1798
- Page 443 and 444: Appendix 24d: Zone D, The Northern
- Page 445 and 446: Appendix 26: Comparison of occupati
- Page 447 and 448: Table 7 Occupational structure (pri
- Page 449 and 450: Sources and Bibliography Primary So
- Page 451 and 452: Trade directories consulted 1767 Sk
- Page 453 and 454: Worcester Post or Western Journal W
- Page 455 and 456:
Warwickshire County Record Office (
- Page 457 and 458:
BA3586, Feckenham apprentice record
- Page 459 and 460:
Levine, D., and Wrightson, K., The
- Page 461 and 462:
Stobart, J., The First Industrial R
- Page 463 and 464:
Smith, C., ‘Population growth and
- Page 465 and 466:
Jones, P. M., Industrial Enlightenm
- Page 467 and 468:
Buchanan, K., ‘Studies in the loc
- Page 469 and 470:
Websites www.a2a.org.uk Access to A